Lidar highlights impressive landslide density on the southern Appalachian Blue Ridge Escarpment, western North Carolina
by Philip S. Prince
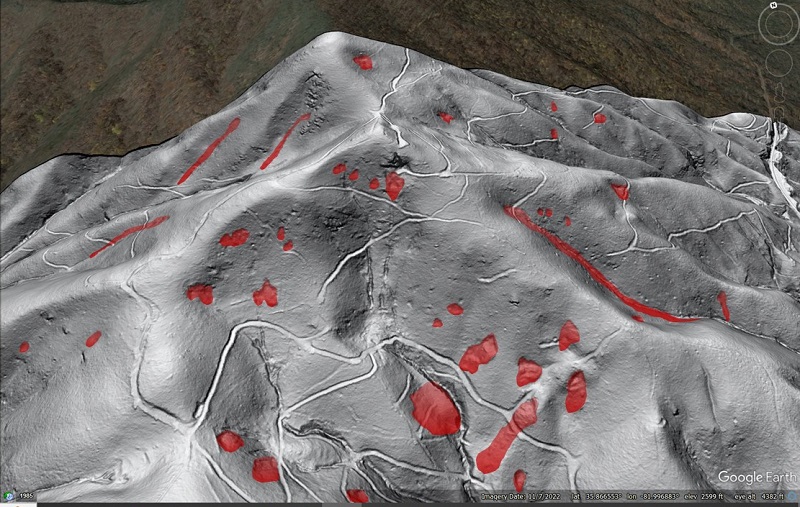
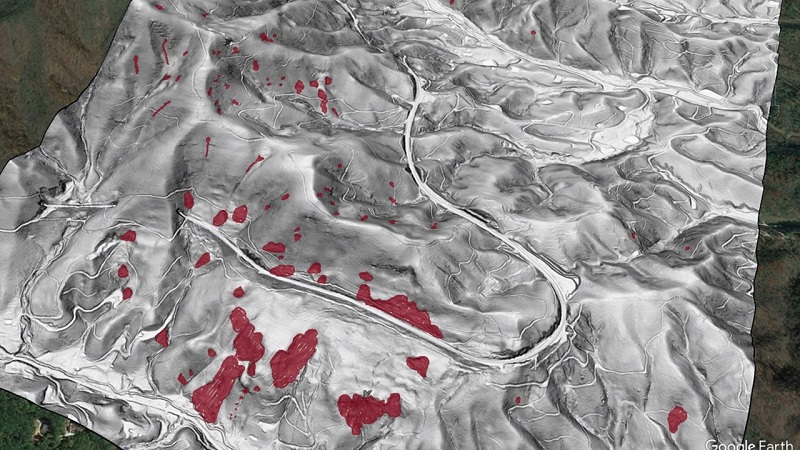
Landslides occur regularly along the rugged Blue Ridge Escarpment in western North Carolina, and lidar imagery provides a way to easily view the accumulated scars of these events that are preserved in the landscape. With a high quality (0.5-meter resolution) lidar dataset, it’s hard to examine much of the Escarpment without seeing a few landslide features. Some slopes have more than others, however, and I think the McDowell County slope shown below probably has the greatest density of slides I have seen in the last 3 years of mapping. The transparent red areas cover definite (or very high confidence) slide features. The yellow arrow points to an active railroad line to provide a sense of scale…possible slides on railroad cut slopes or embankments are not marked.
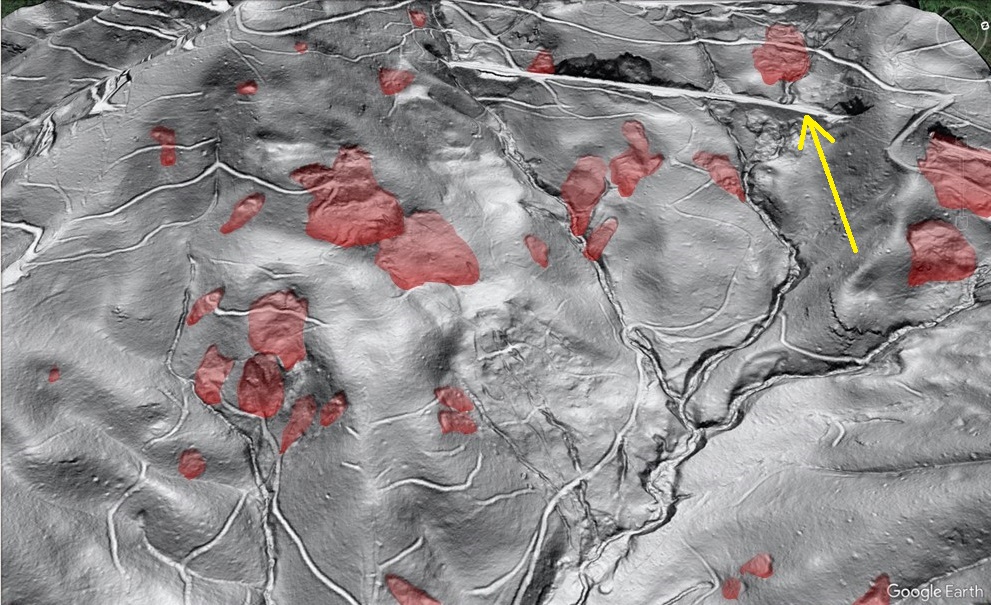
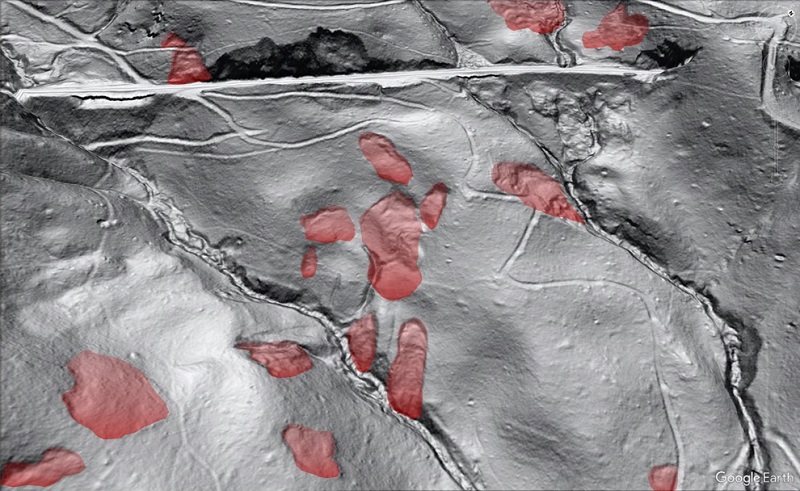
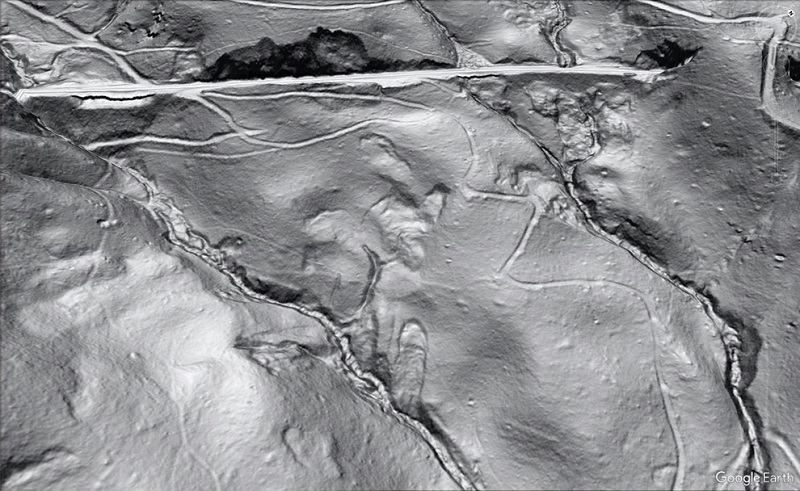
The area shown above is surprisingly small to host so many slides. The area with marked slides covers about 0.3 square miles, or 0.8 square kilometers (204 acres or 85 hectares); this excludes the distant slopes seen at upper left, where no slides are marked. Like so much of Appalachia, the slides are not visible without lidar imagery. Despite their crisp outlines, many are cut by undamaged logging road grades, suggesting the slides are many decades old. The GIF below compares aerial imagery, unmarked lidar slopeshade, and marked lidar slopeshade.
Many of the slides occur in clusters and are not significantly displaced. The cluster of slides above right center and below the railroad grade is worth a look in detail.
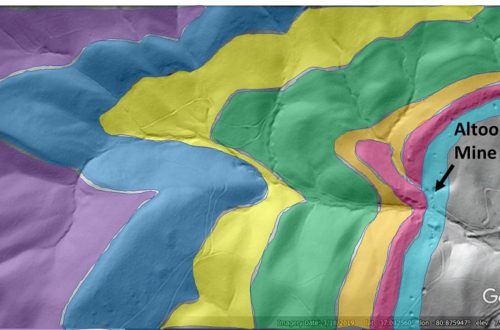
The images shown above are captured from kmz files I made, and a zoomed-out view provides some larger scale context. The previous images are from area A1.
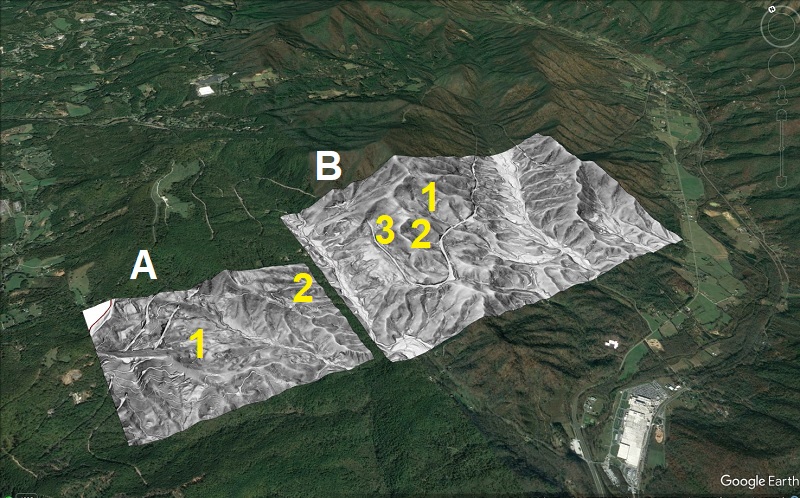
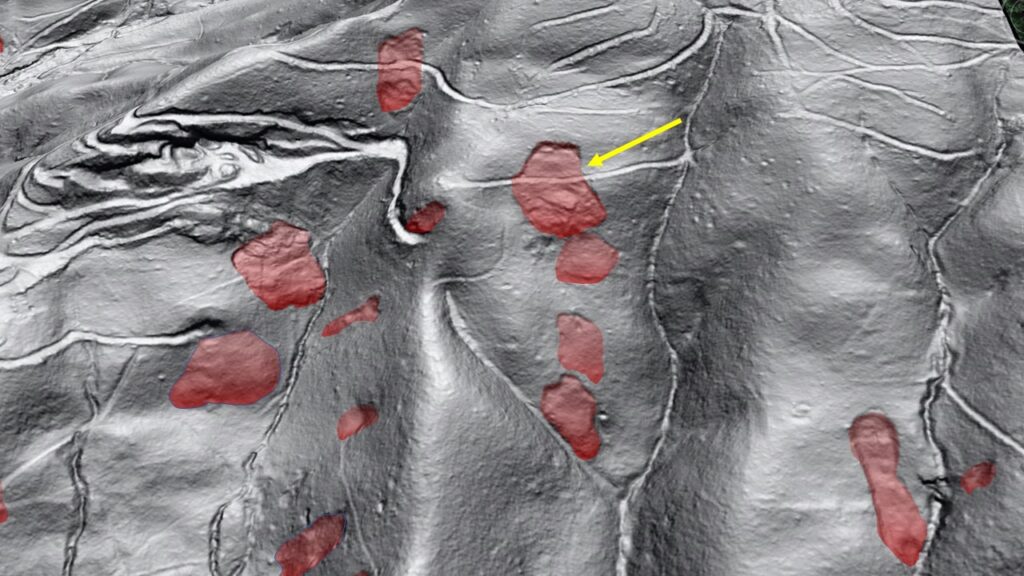
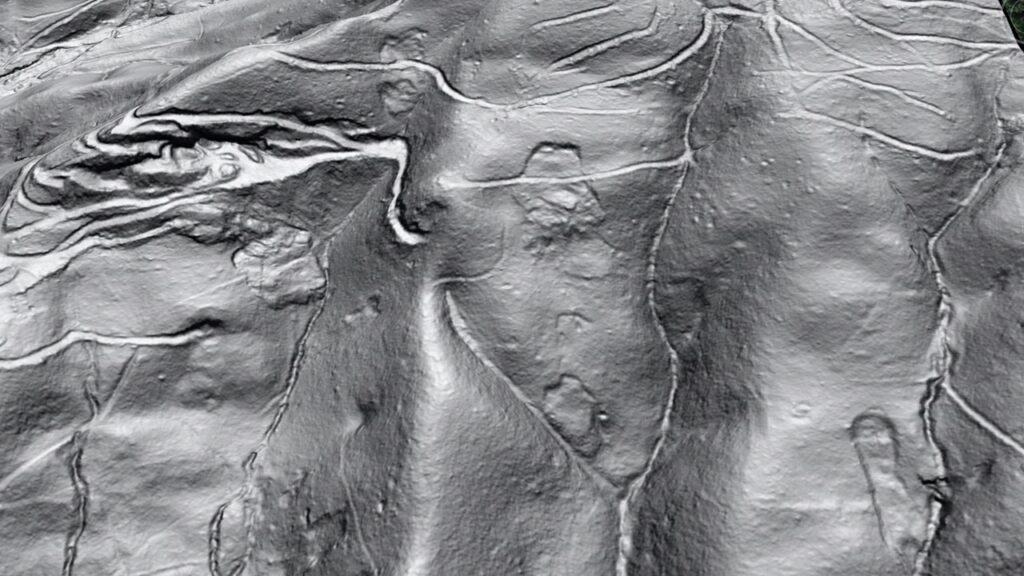
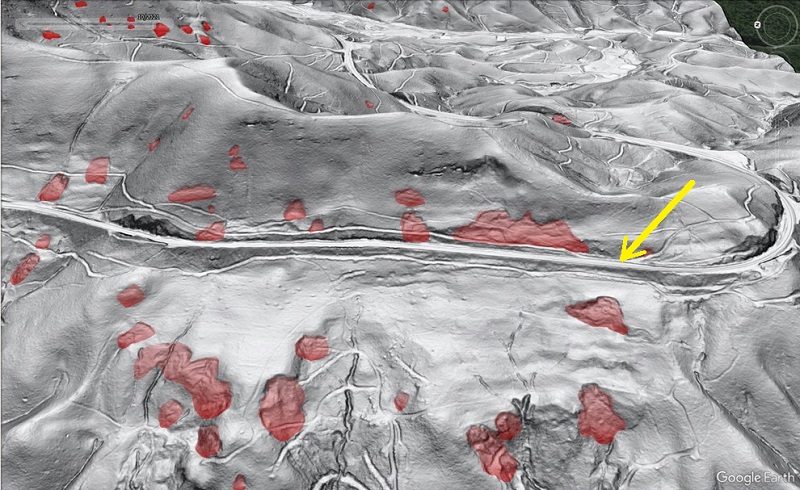
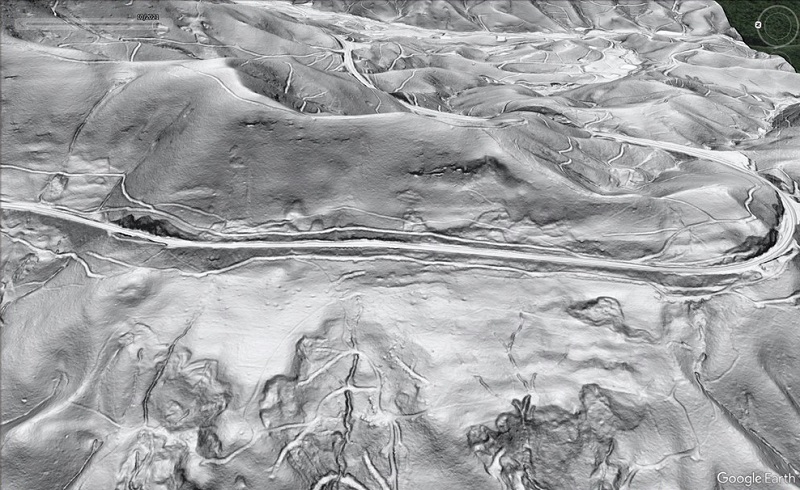
Area A2 shows comparable slide density, with numerous minimally displaced, largely intact slides. The slide indicated by the yellow arrow is 130 ft (40 m) across. The road grades are single-track logging roads. Notably, they are not offset by the upper two slides…this is more clear in the lower, unmarked image.
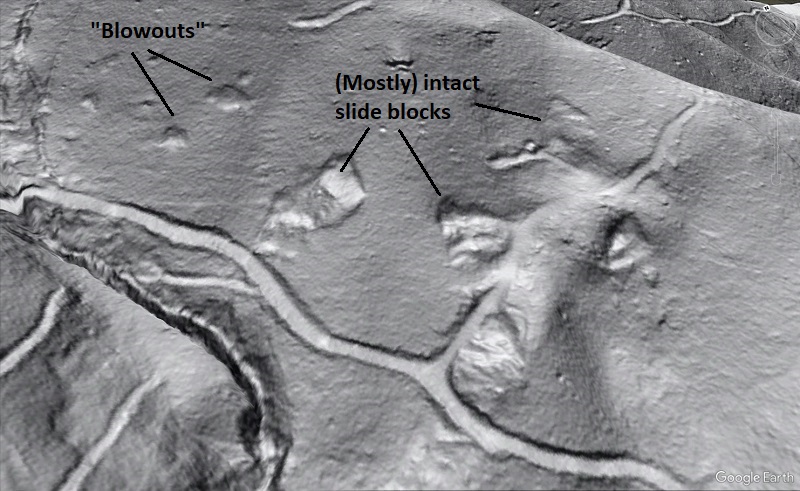
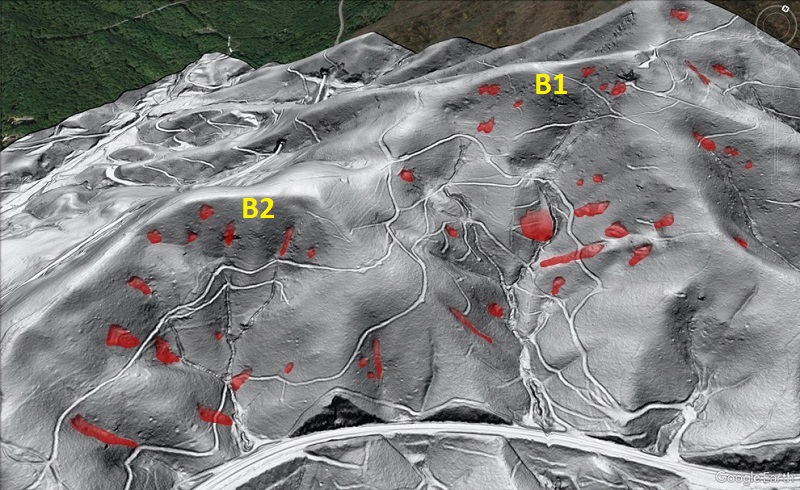
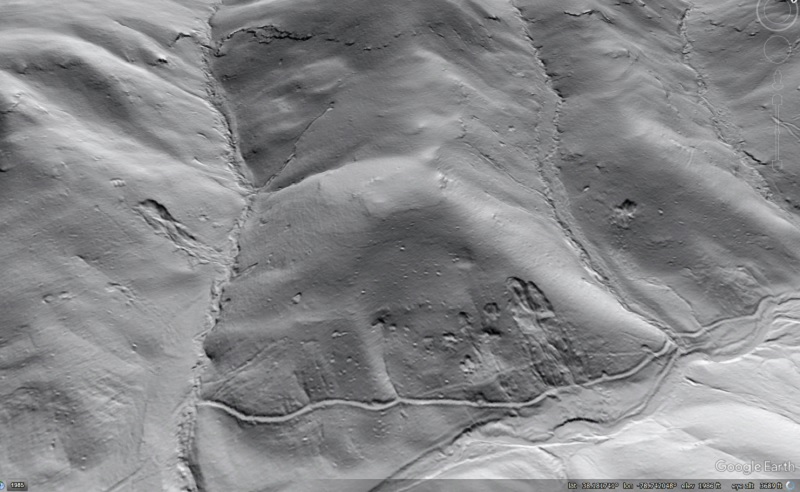
Similar landslide density is visible in area B1. The style of the slides is somewhat different–many are small “blowout”-type slides. This difference in style may result from the different aspect of the slope with respect to underlying bedrock structures.
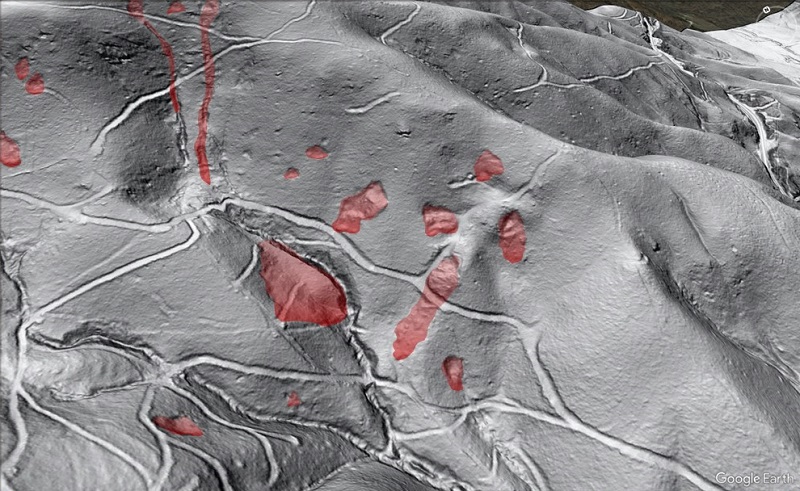
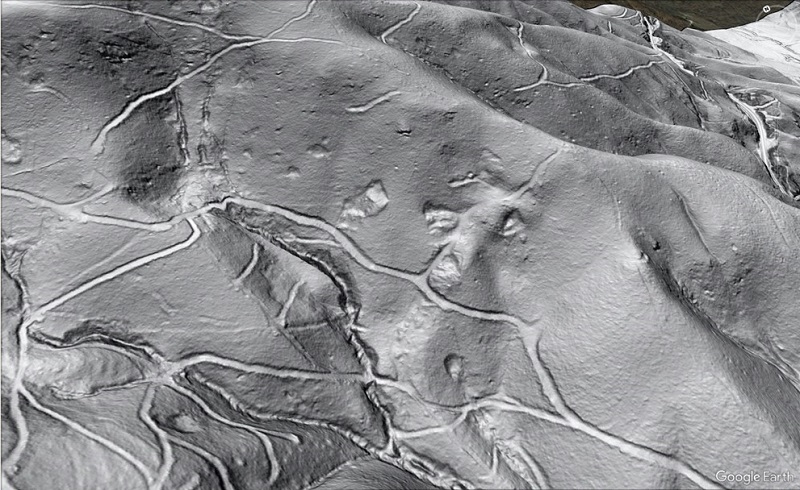
The central portion of the image above provides a nice view of the contrast in slide style and the resulting traces in the landscape.
Both areas B1 and B2 host a very high number of slides. Again, the railroad grade at the base of the image provides some sense of scale. None of the slides marked in the image below are seen to offset any of the logging road grades, despite the crisp, well-defined appearance of the slides.
Area B3, just over the ridge (to the left) of B2 above, is also a mess. The arrow points to the railroad line for reference.
Area B3 is distinct in terms of its aspect and its relationship to bedrock structure. Dip of bedrock foliation at B3 is significantly less steep than the slopes above the railroad line, creating cliffs and ledges. Lidar imagery suggests that large amounts of colluvium and talus have accumulated below these ledges. Failure in colluvial deposits is widespread in the region, particularly as the deposits weather, so a slope like this is certainly expected to show evidence of failure, regardless of land use or construction.
An overall view looking north across area B shows slide distribution across the face of the Escarpment towards the valley at upper right. This isn’t a perfect labeling of each and every slide, but it’s pretty good. Slide density does decline significantly below the railroad grade and is much less on the distant ridge at top and right.
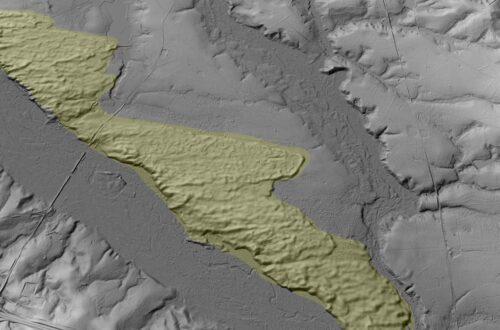
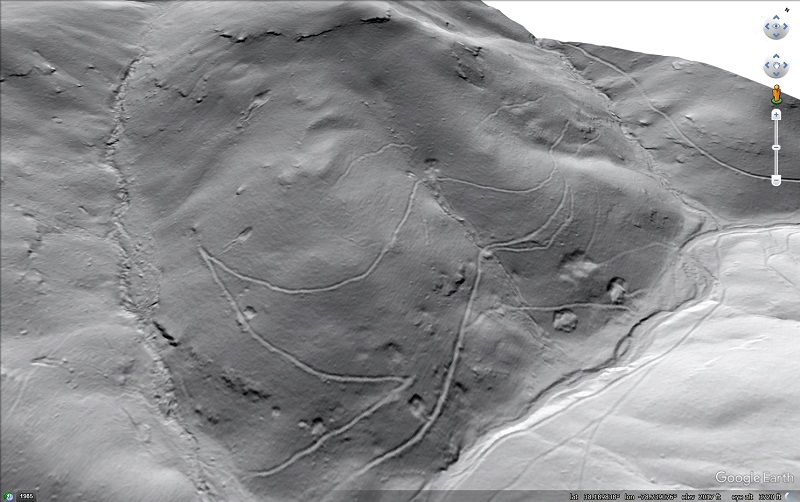
So, why have so many landslides occurred on these slopes? The most likely explanation is an extreme precipitation event. This area was heavily impacted in both 1916 and 1940 by extreme rainfall events, and the clustering of slides and their lack of damage to mid-20th century road grades would fit a connection to either of the storms nicely. These McDowell County slopes also resemble slopes in the headwaters of the Moorman’s River west of Charlottesville, Virginia, which experienced numerous slides due to an exceptional thunderstorm event in 1995. The two Moorman’s River slopes shown below (in lidar hillshade instead of slopeshade) reveal numerous slides that cluster in a similar fashion to the McDowell County examples. As usual, single-track logging roads provide a sense of scale.
Details of bedrock geology, colluvial or residual soil development, shallow groundwater, and land use may also control the McDowell County slide clusters. Because of the area’s history of extreme rainfall events and land use, many variables may have worked together to produce the high density of landslides. They may not have occurred together, either, although their comparable preservation and pre-logging road development suggests that they could have. This area will received detailed landslide mapping in the coming months, and field investigation may shed more light into the details of the slides’ setting. Until then, just knowing what the land surface looks like and what sort of slope behavior is possible in the area is useful and interesting.