A sandbox model of China’s “other” Rainbow Mountains that fits in the palm of your hand
by Philip S. Prince
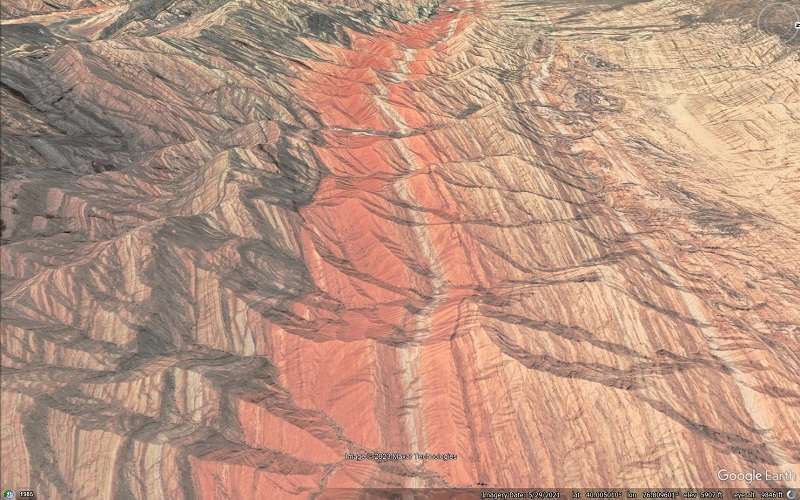
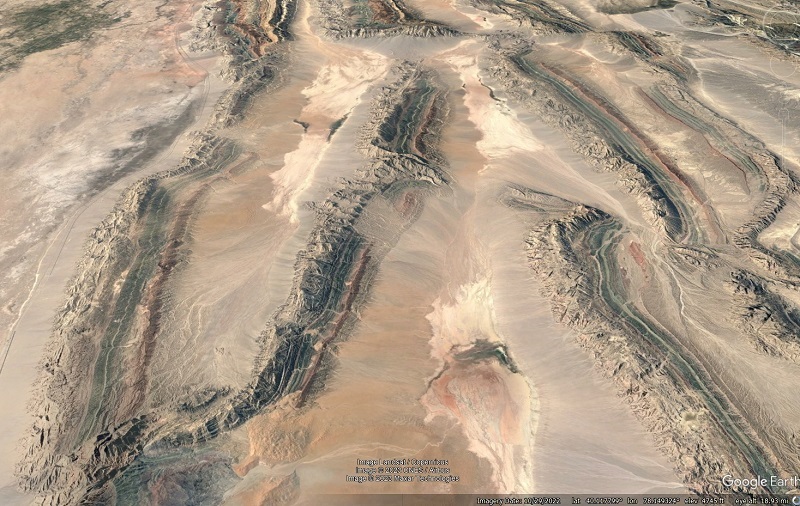
If you spend any time on the internet, you’ve probably seen an image of China’s Zhangye Danxia Landform, also known as the “Rainbow Mountains.” While these colorful landforms get most of the hype, China hosts another, arguably more impressive, zone of colorful, tilted sedimentary layer mountains–the Keping fold-and-thrust belt. Located at the northern edge of the Tarim Basin, the Keping showcases elongated ranges of pink, green, purple, and tan mountains that stretch for 10’s of kilometers and are readily seen from Google Earth. The two images below show details of some of these ranges, where distinctly colored sedimentary layers are easily visible.
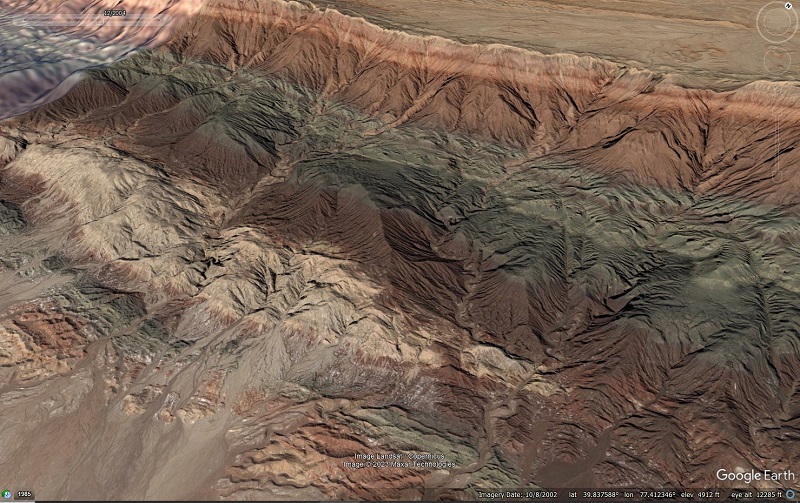
The following image shows a zoomed-out view, with the color patterns still visible in each of the elongated ridges/ranges.
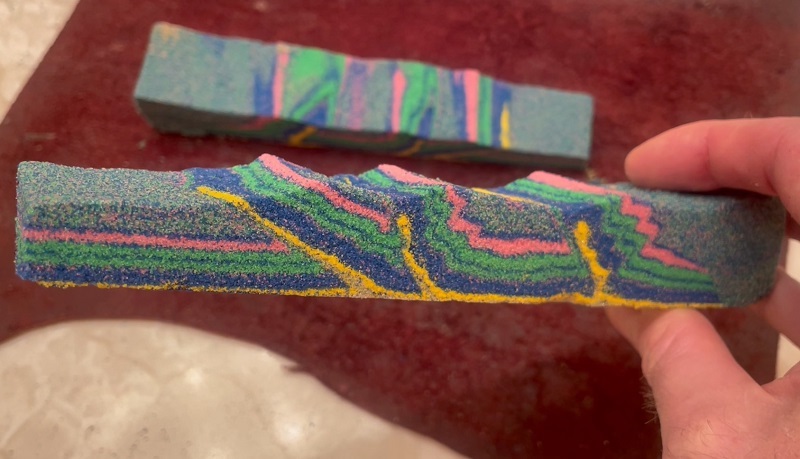
The beauty of landforms like these offers a nice (and seldom exploited) opportunity to connect surface landforms with underlying geologic structure. The lack of vegetation and varied color of the sedimentary layers clearly illustrates that tilted layers underlie the Earth’s surface and form the mountain ranges, but the nature of the process of tilting and erosional exposure, as well as what the layers do far below the surface, is less obvious. A basic analog “sandbox” model using colored sand layers can capture these overall processes and put the large, real-life landforms into a more understandable context. This “scaling down” of size and time is useful, as a modern-day observer only sees a localized snapshot of a large-scale, millions-of-years process. I made the sandbox model below in a couple of hours to shrink and fast-forward the development of the Keping fold-thrust belt. The layer sequence was specifically chosen to match the stratigraphy seen on the Keping mountain ridges.
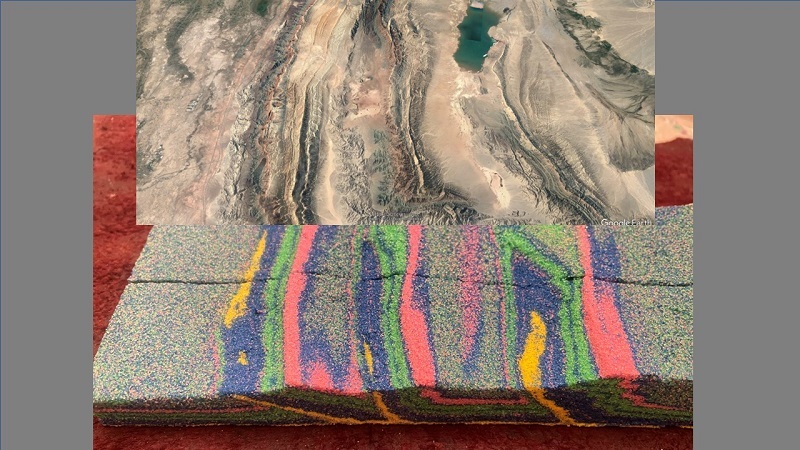
The model was not produced in the solid, hold-in-your hand condition as seen above–more on that below. It was made by shortening a sequence of loose, dry sand layers against a fixed backstop. The result was thrust faulting and associated folding/tilting of the layer sequence, with uplift of the tilted layers as they moved up thrust ramps. A bit of sand was carefully scraped away from the uplifted areas to replicate local erosion above the thrust faults. The real Keping fold-thrust belt essentially formed in the same way; a sequence of sedimentary layers was shortened against a thick, mechanically stronger mountain belt core by movement of the underlying tectonic plates. The image below shows a top view of the model below a Google Earth view of the real fold-thrust belt. In both the real fold-thrust belt and the model, thrust faults upturn and repeat the layer sequence three times.
The GIF below shows an abbreviated version of the model setup. Deposition of layers, followed by shortening and erosion, expose the buried colored layers where they tilt and uplift above thrust faults. While this is a highly simplified model, it illustrates the basic steps in the formation of the Keping fold-thrust belt (a millions-of-years process!) as it is seen today.
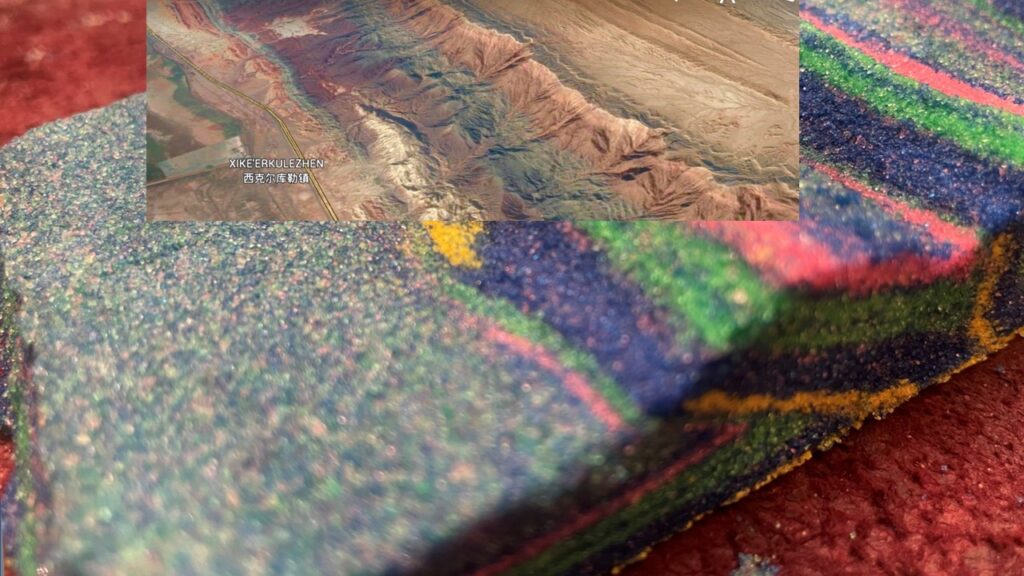
The model was soaked with gelatin and carved slightly before it completely dried to produce the final “topography”; the crisp ridges in the final, solid model cannot be produced in the loose, dry sand before gelling for preservation. I tried to scale the overall thickness and length of the layer pack, along with individual layer thicknesses and colors, to match up closely to parts of the real Keping fold-thrust belt. As seen below, it worked well. The small panel of Google Earth imagery grafts nicely onto the model.
Loose, dry sand is a good analog for rock in the upper few kilometers (generally less than 12km or so) of Earth’s crust due to its internal frictional strength/behavior and lack of cohesion. As a result, structures made in sand layers at the centimeter scale actually do reflect geometric characteristics of kilometer-scale geologic structures. The Keping fold-thrust belt is fairly simple in that a single, basal detachment largely controls its structure, so it is readily replicated with a basic model.
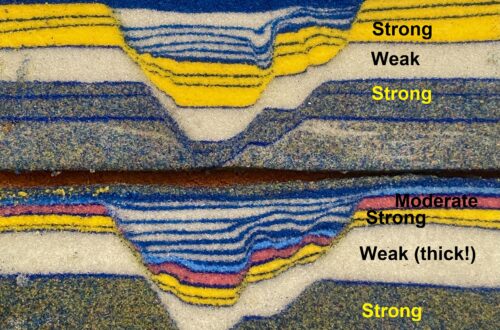
A notable detail of the final “carved” model is the size of the mountain topography. It is not particularly large compared to overall thickness of the fold-thrust belt and the size or depth of the thrust structures. This relationship is seen in all of Earth’s sedimentary fold-thrust belts; surface topography is always significantly smaller than the scale of the subsurface structures that support it. The real Keping is up to 10 kilometers thick; the mountain ranges developed on the thrust sheets rise about 1.5 kilometers above the surrounding landscape. The “mountains” carved onto the model are actually a bit too big. If you can read backwards, the vertical scale on the cross section below will give you a sense of the size/depth of the real Keping system.
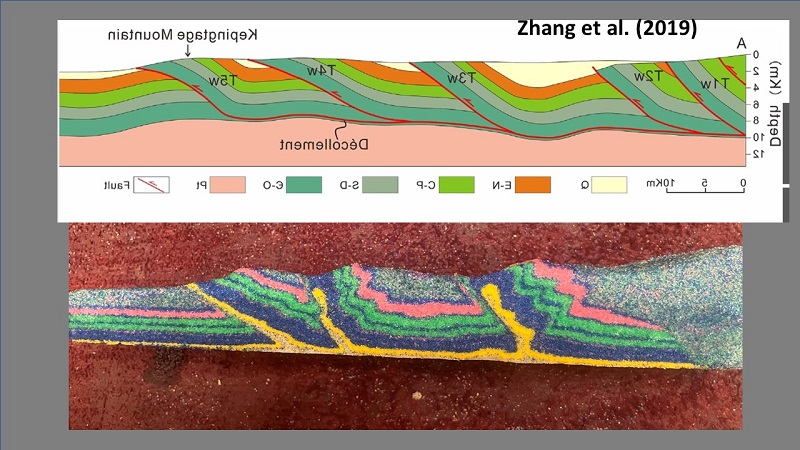
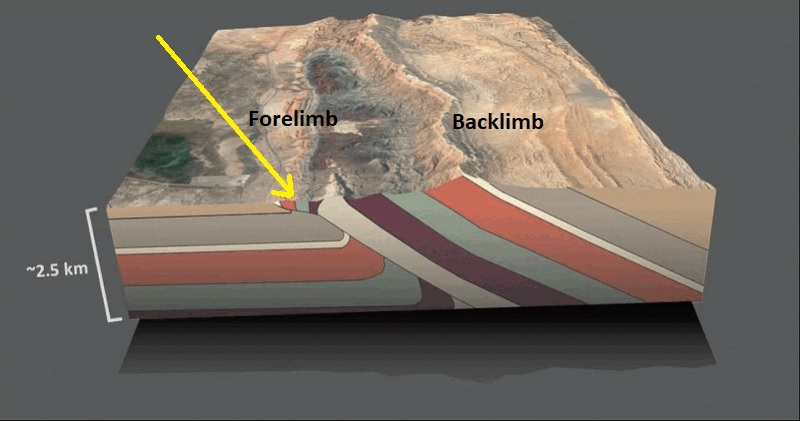
I drafted the generalized block diagram below to give an idea of basic structure beneath the real outermost Keping ridge (the Kepingtage Mountain, I believe), with indication of physical size and depth. It is based on both the cross section above and details of the sandbox model. Note the scale bar at left. The sequence of layers that is thrust faulted to form the Keping fold-thrust system changes in thickness along its length, so the thicknesses don’t quite match the published cross section above.
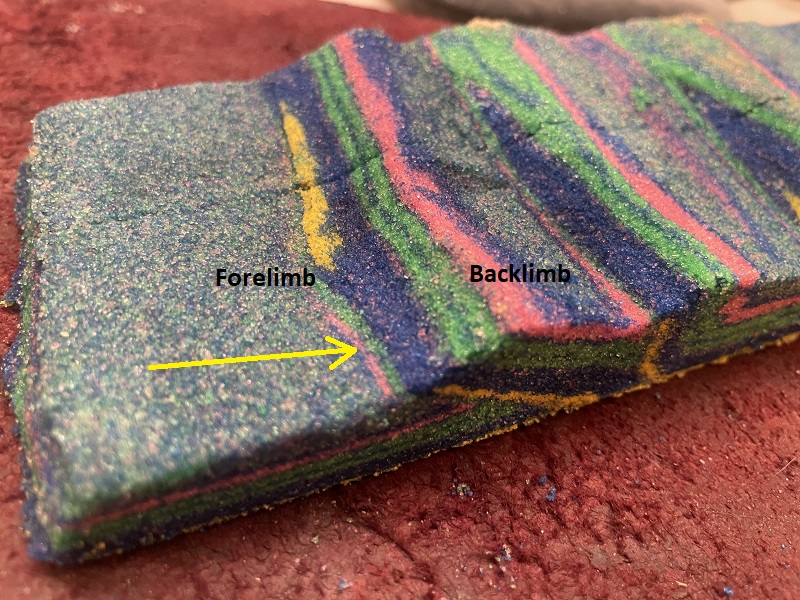
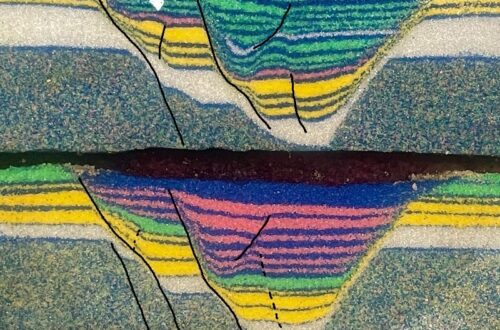
The small model, like many analogue models, goes beyond capturing the overall details of the real structure–many smaller, more subtle details are also reproduced. Sharply upturned pink and green layers (yellow arrows) are visible on the forelimbs of the real structure shown in the GIF as well as in the model. These upturned layers are cut off by the main, frontal thrust fault below the surface…and probably not very far below it. They are also atypically thin and distorted due to their forelimb location, immediately above the thrust.
Analog models are great to look at, but it is important to remember that they develop their structural architecture due to the same physical principles that guide the formation of full-size, kilometer scale geologic systems. The defined geometries seen in analog models are very much present at the kilometer scale, where they are just too big–and buried–for an observer to appreciate. Settings like the Keping fold-thrust belt offer a chance to see clearly expressed evidence of this defined geometry. This style of pattern recognition can then be applied elsewhere, such as in settings where surface vegetation obscures a clear view of rock outcrop patterns.


You May Also Like
Sandbox model anticlines formed above normal faults during extension
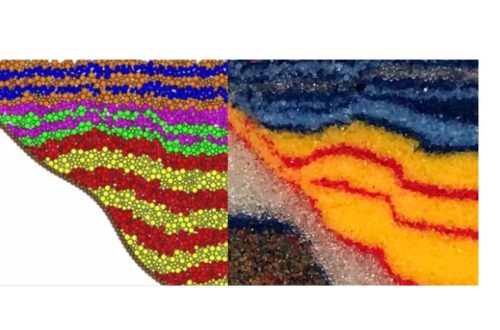
Real sandbox model meets “numerical sandbox” model…an interesting comparison of dry granular media and discrete element simulation