The geology lab cross-cutting relationships exercise as a sandbox model
By Philip S. Prince
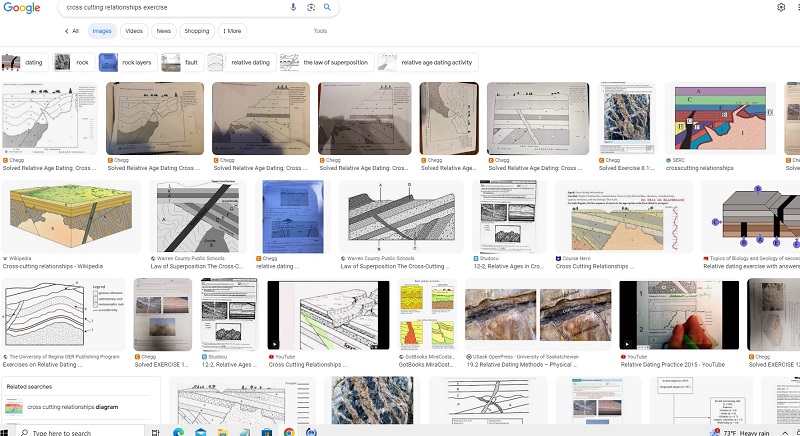
If you have studied geology in recent decades, you have probably encountered a cross-cutting relationships exercise, particularly in a lab class. These exercises are an important part of establishing the order in which particular events occurred, and thus understanding which structural and stratigraphic feature may impact–or be impacted by–other features. Most cross-cutting relationships exercises features deformed sedimentary layers, angular unconformities, igneous intrusions, and faulting that offsets pre-existing elements of the exercise. Give “cross-cutting relationships exercise” a Google search, and you’ll find no shortage of examples:
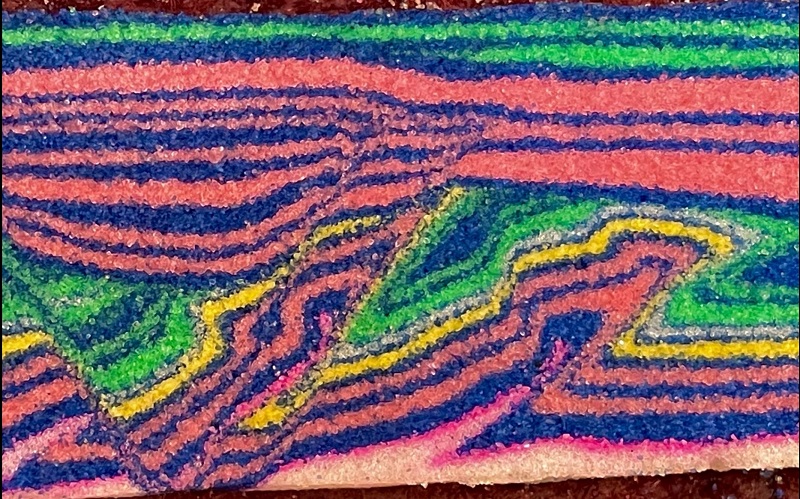
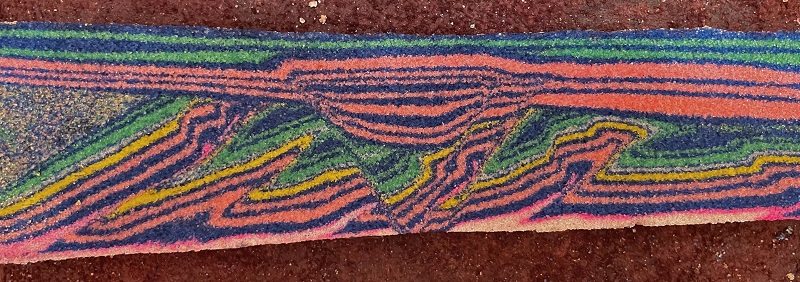
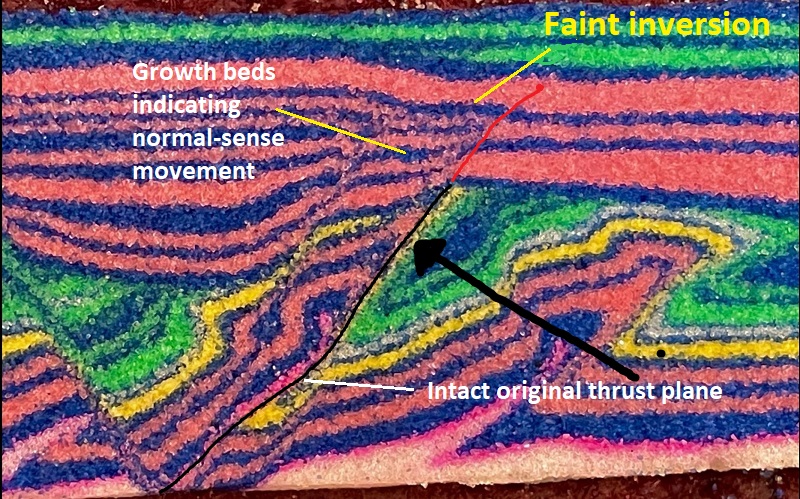
I thought it would be interesting to turn this ubiquitous classroom activity into a real-life analog model. Igneous intrusion is a bit beyond my scope, but deformation, erosion/unconformities, and subsequent deformation are easily achieved in a 3-D “table top” model with overlapping, movable base plates. The image below shows a portion of the model I produced. This first look is a zoomed-in detail that is reminiscent of the format of the exercise drawings.
I admit that the color scheme is grotesque, but I purposely wanted to reduce extreme contrasts so that the appearance is initially a bit confusing and requires that angular relationships and offsets be carefully studied (the colors may be especially bad for folks with red-green issues). All of the events that affected the model can be observed in this detail. The events are listed later in the post, but give this image a look first to see if you can figure out what happened and in what order.
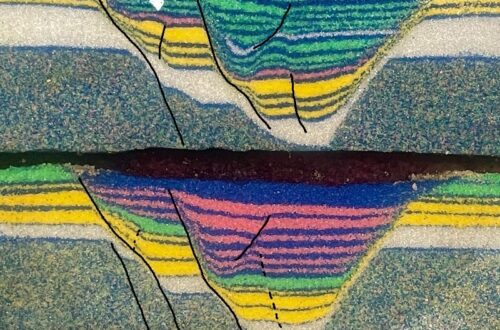
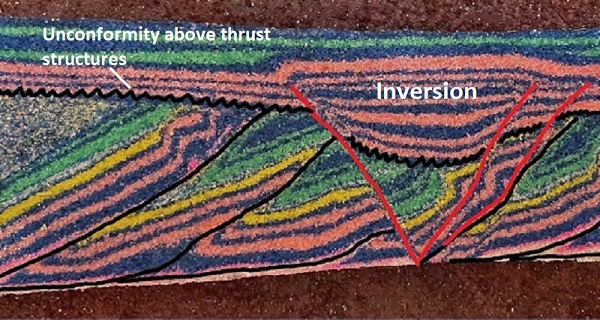
The full model is shown below.
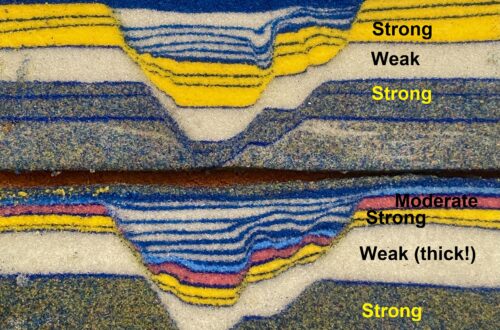
When the entirety of the model is seen, numerous sequential thrust structures are easily visible. The top of the thrust structure at far left terminates suddenly against nearly flat-lying layers above it. Upon closer inspection, other thrust structures can be seen to terminate at an angle against the overlying blue and pink layers. This termination is an angular unconformity, meaning an erosional event post-dates thrust faulting and associated folding. The squiggly black line in the annotated image below shows the angular unconformity.
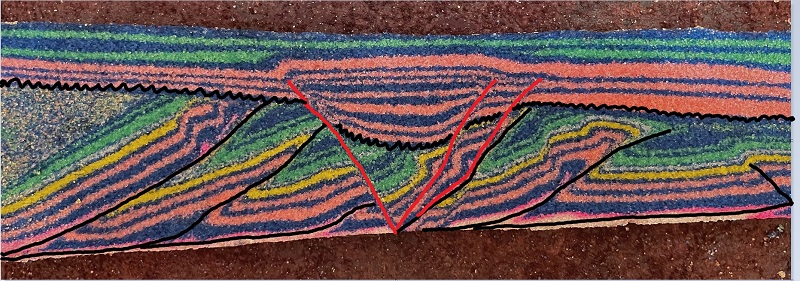
In the middle of the model, the angular unconformity is offset and down-dropped by normal faults. This normal faulting post-dates the angular unconformity. Several pink and blue layers present above the down-dropped portion of the unconformity are not present elsewhere in the model; these are growth strata that were deposited in the extensional basin that developed above the normal faults. The thick package of strata is no longer in a structurally low basin, however, as it has been inverted after normal faulting and basin filling. The uppermost green layers lap onto the uplifted, inverted basin, with an undeformed green layer covering the basin and post-dating inversion.
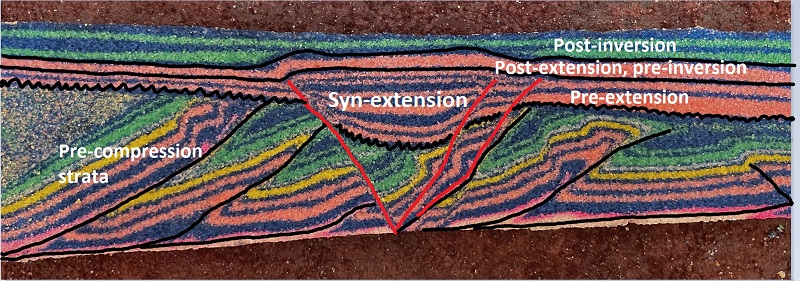
Which beds pre- or post-date extension and inversion is not immediately obvious, so the annotated image below labels these intervals.
A notable detail of inversion in the model is the reactivation of normal faults during the inversion process. Inversion was produced by highly oblique movement, with the portion of the model on the right side of the basin moving towards the observer during the final deformation sequence. Oblique movement permits reactivation of existing normal faults, which are too steep to reactivate under direct compression in a model using these analog materials.
An even more interesting detail is that the fault bounding the extensional basin on its right edge was initially a thrust fault that back-rotated as more thrust structures developed after its formation. During extension, the back-rotated thrust reactivated as a normal fault due to its steeper dip. During inversion, it reactivated yet again, though only slightly. The fault thus experienced thrust, normal, and reverse/inversion movement during the various phases of model development. This intriguing structure is detailed below.
The overall “order of operations” is:
- Deposit white, pink/blue, yellow, green/blue sequence
- Compression and thrust belt development affecting layers from step 1.
- Post-thrusting erosion of compressional structures.
- Deposit two pink/blue layers atop erosional surface; angular unconformity.
- Extension and normal faulting; deposit several pink/blue sets in growing basin. (Normal-sense thrust reactivation).
- Deposit one thick pink/blue horizon atop entire model, including filled basin.
- Inversion of basin, deforming the thick pink layer deposited in 6 as well as the basin fill. (Reverse-sense reactivation of thrust/normal fault).
- Deposit green/blue sets.
Classroom exercises of this type are a key step in learning to see geologic structural relationships as an expression of various phases of movement and change. While the exercises are specifically produced as simplified classroom examples that are a bit out of context, the interactions they (and the model) show are very much real-world features. Compare the conceptual diagram below depicting a portion of the Pannonian Basin of Hungary with the model. The image was sourced here; I reflected it to match the sandbox model’s thrust orientation. Note the scale bars; this diagram depicts kilometer-scale features that are vertically exaggerated.
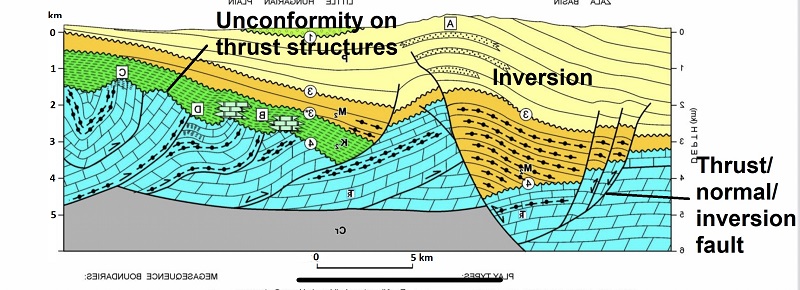
The features shown in the diagram generally match the idea of the model.
Interestingly, I didn’t intend the model to match the Pannonian example. The model came first, and I wanted to seek out a real-world example. I knew the Pannonian Basin was an example of a setting where extension had caused pre-existing thrust belts to subside and be buried, so I went looking for a basic visual to depict interpretations of this structural style. I wasn’t aware of inversion in the area; this was a nice surprise in terms of matching a diagram to the model!
The compression-extension-inversion sequence depicted in the Pannonian example certainly happens in other settings where subduction zone-related compression transitions to extension due to slab rollback. I admit I don’t know exactly what triggers the return of compression and associated inversion, and I would absolutely love to know the explanation! Numerous other cross-cutting tectonic events are possible as well, such as Mesozoic, continental break-up rifting developing extensional basins in the Paleozoic compressional Appalachians. The Mesozoic event introduced plentiful diabase dikes into the multiply deformed rock mass. The modern-day Appalachian stress field is characterized by North American margin-parallel compression, which might be appropriate to start inverting the basins. A geologist working in the Appalachian Piedmont would need to consider all of these events and factors in order to fully understand the Piedmont surface and subsurface, providing another example of how the good old cross-cutting relationships exercise has real relevance.