What’s under that anticline? Fold-thrust belt interpretation ideas from geologic sandbox models
by Philip S. Prince
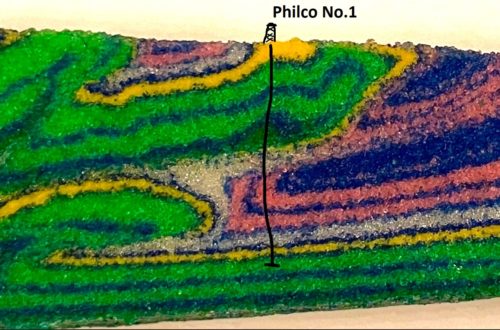
A look around this website will make it pretty clear that I like sandbox models, mostly because I think they look cool. Beyond aesthetics, geologic sandbox models can be useful tools for thinking about approaches to geologic interpretation and learning to visualize and reproduce realistic structural styles. The model shown below illustrates an interesting case of how surface geologic mapping, remote sensing, and an understanding of how various sedimentary rock types respond to tectonic deformation could be used to figure out what sort of rock structures might be present under a given point on the land surface. Like many of my models, this model represents a sedimentary fold-thrust belt whose thickness would be measured in terms of miles or kilometers. Specifically, the model is intended to reflect a “young” thrust belt which has not been significantly eroded since the end of the crustal shortening that formed it.
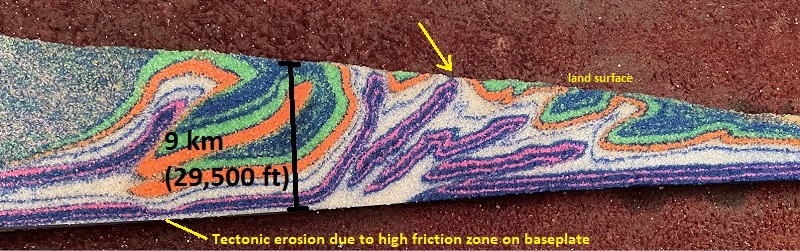
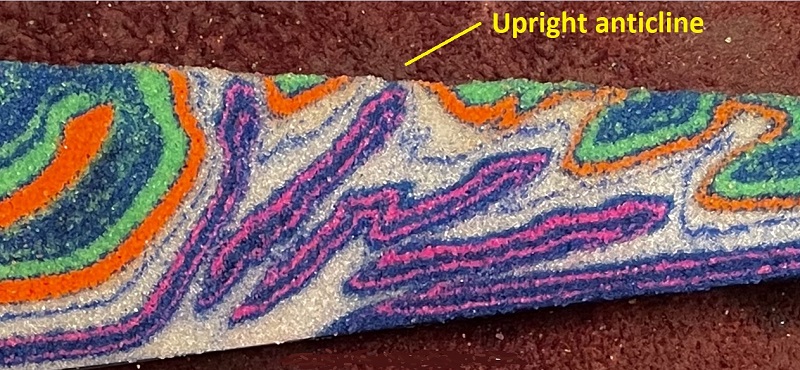
This model definitely satisfied the “looks cool” requirement, but it also contains a particularly interesting structural feature: an upright anticline exposed at the model’s surface, which is indicated by the yellow arrow above. This surface fold is interesting because of what is underneath it, namely several “slices” of the pink/blue interval stacked on top of each other. Complex structures like this are common in Earth’s sedimentary fold-thrust belts and are tough to fully interpret without seismic surveys or drilling through them, but field- and concept-based information can be gathered to at least give some idea of what might be beneath an anticline like this one. I offer up a few of my own thoughts here, and there are undoubtedly many other possible strategies.
First, the anticline itself is worth a closer look:
The anticline is upright, and the orange and green layers that define its limbs have comparable dips. Dip steepens significantly towards the core of the anticline, with layers at the right hand edge of the pink/blue interval being nearly vertical next to the much shallower orange layer. The white material (glass microbeads) is much weaker than any of the colored sand layers; it represents shale in terms of real-world rock types. A geologist cruising across this anticline would certainly note the presence of the shale and how it separates shallower dips from steep dips.
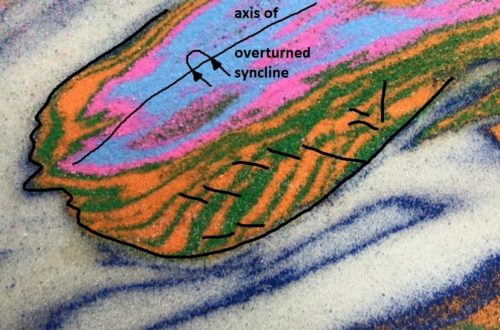
Moving left of the anticline, a geologist would encounter a thrust fault that has been tilted backwards until it is slightly overturned. This is strange, and will be significant later. The fault itself would be obvious due to the rock types it separates, but its orientation would be perplexing.
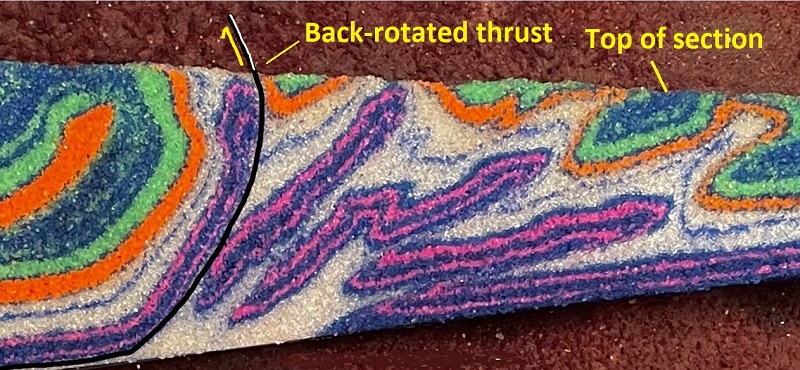
Moving to the right of the upright anticline, a geologist would encounter a thrust fault placing the orange and green layers atop a much younger blue layer that defines the top of the folded/thrusted section of layers (“top of section,” above). This is a notable feature, but it doesn’t help much with figuring out what is under the upright anticline, and might even cause confusion (more on this below, too). This potential confusion arises largely from the shape and width of the anticline, which indicate that it doesn’t extend terribly deep into the thrust belt, as diagrammed below.
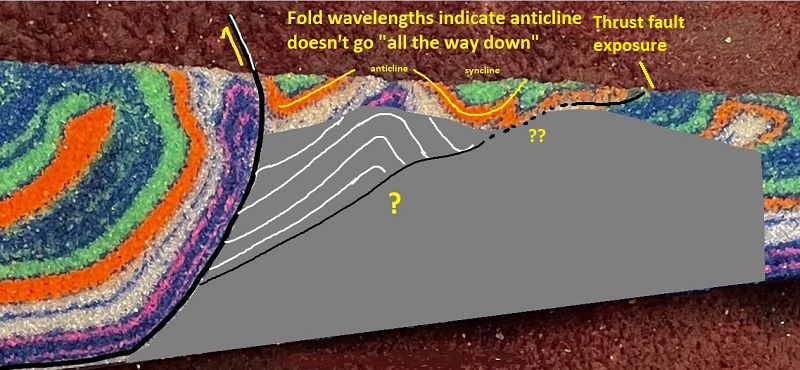
The width/wavelength of the anticline and its neighboring synclines are very good evidence that the upright anticline is likely developed above a thrust fault, represented by the black line above the question mark. This bit of information is a good starting point, but determining what layers are below the thrust fault is another challenge….and given the thickness of the fold-thrust belt implied by the big syncline on the left, whatever is down there is likely stacked on top itself a few times. The thrust fault to the right of the anticline, which places orange and green atop the younger “top of section” layers, might suggest orange and green extend beneath the upright anticline. This possible geometry is sketched below. Note reference to structural repetition and particularly dip in the deep syncline at left as an indicator of thrust belt thickness.
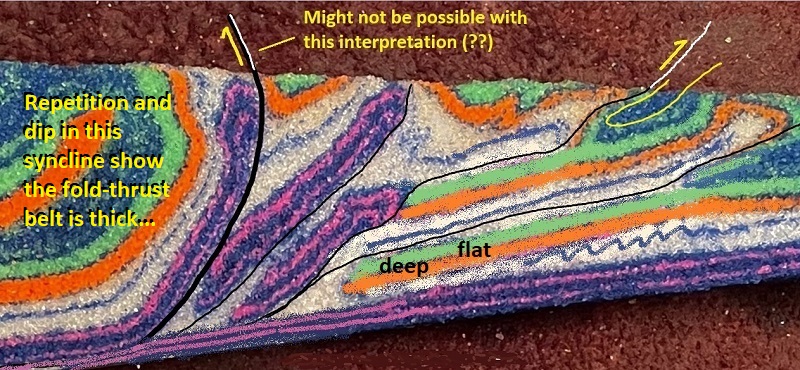
I sketched this up in an effort to offer an alternate subsurface interpretation, and I think it is “believable,” at least at a glance. It would be easily disproven, of course, by drilling or seismic data, but are there other, massively less expensive ways to tell that it is wrong? I think there are a few, starting with the back-rotated thrust fault. I don’t think the geometry sketched above would produce or preserve the back-rotation of the fault as it exists in the model. I think the additional stacking of the pink/blue interval (meaning more “slices” with thrust ramps) is necessary to produce the back-rotation, and the geometry drawn above would actually begin to “un-rotate” the back-rotated thrust if the deepest orange-green flat (“deep flat”) advanced further. I haven’t actually sketched all this out, but I am suspicious that it’s legitimate…
Another useful approach would be additional mapping in the vicinity of the upright anticline. Additional sections from the model are shown below, and one of them shows a tight fold instead of a thrust to the right of the upright anticline.
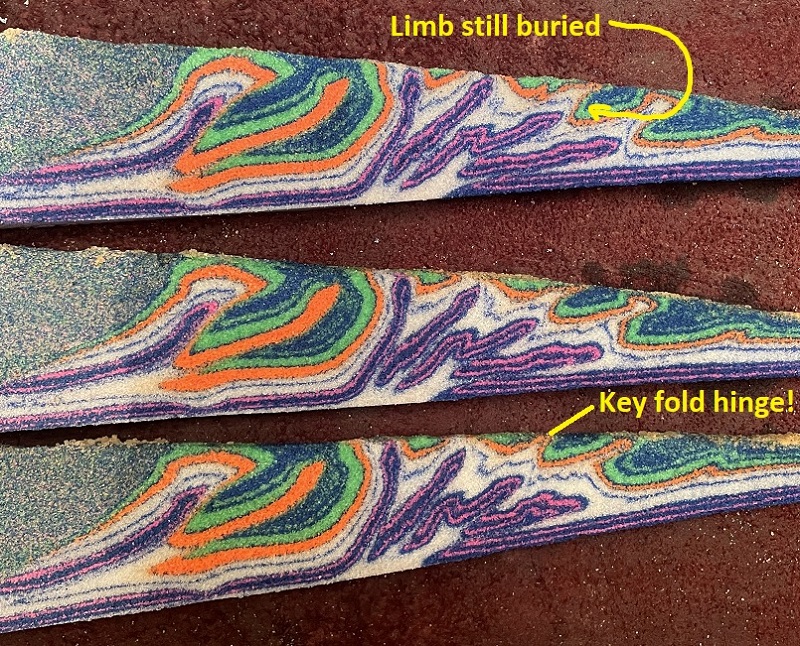
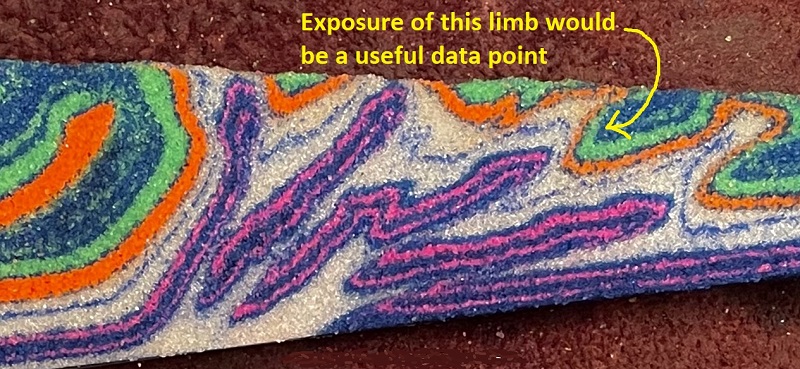
If enough of the forelimb of the fold could be seen to convince the geologist that the structure is not in the hanging wall of a thrust, at least one thickness of orange and green would be confirmed to not extend under the upright anticline. This detail would suggest fault repetition of pink/blue and direct the geologist towards a more accurate interpretation. Were the fold hinge labeled above not visible itself, seeing the upturned footwall limb of the same structure in a deeply eroded area would have the same useful effect of showing that the upper orange-and-green footwall does not extend under the upright anticline.
Beyond field mapping, examination of gravity anomalies in this portion of the fold belt would also be useful in suggesting what stratigraphic interval is repeated below the upright anticline. Nearly all of the fold-thrust belt’s thickness below the upright anticline is made up of the repeated pink/blue horizons. If pink/blue were a limestone/dolomite (carbonate) interval and orange/green were a sandstone-shale interval, a gravity high would occur in the vicinity of the anticline due to the stacking and concentration of the dense carbonate rock. If pink/blue was sandstone and orange/green was carbonate rock, a gravity low would occur beneath the anticline.
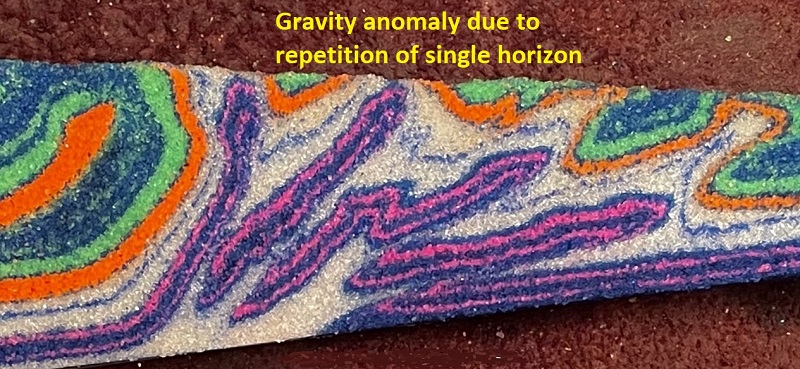
In either case, such a gravity anomaly would very quickly eliminate the repeated orange/green model sketched earlier in the post and confirm repetition of pink/blue. This approach has been used in the Appalachian Valley and Ridge, and I summarized it in a post a few years ago.
Even if repetition of pink/blue beneath the anticline was confirmed by field data and additional remote sensing like the gravity anomaly approach, details of the structure would still be very difficult to sort out. Thickening of the weak white “shale” layers is significant, with the middle shale layer (number 2) showing extreme thickening below the upright anticline.
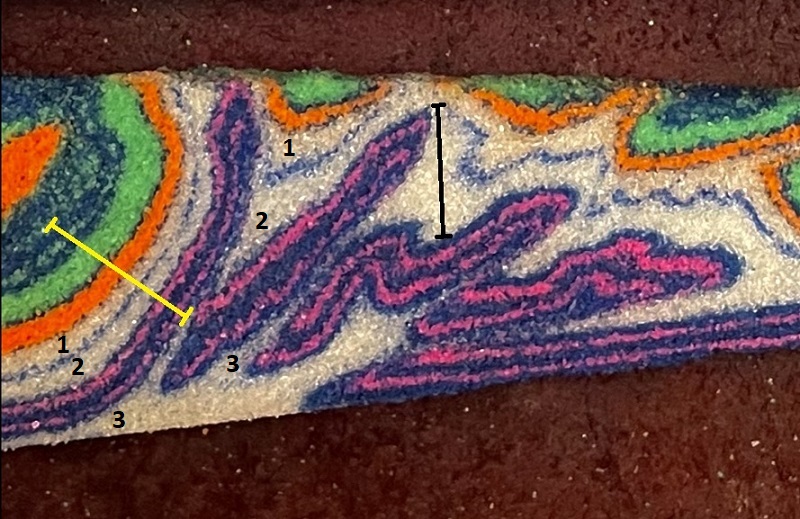
The yellow line above shows the thickness of the full section involved in folding and thrusting (much of it is, of course, eroded away above the upright anticline). The black line shows thickness of shale 2 beneath the anticline, which is (depending on where it’s measured) over 75% of the full section thickness. The thickness reflects shale 2 being “scraped off” a lengthy portion of pink/blue and piled up in one spot, but it still might seem odd to interpret such an extreme thickening. The thickening shown above is indeed localized, and inspection of the other sections in the earlier image shows variations on how the weak white layer moved around and thickened within the model.
I think that interpreting at least two repetitions of pink/blue beneath the upright anticline would be possible from surface and gravity data at the erosional level of the model. Going deeper without some information about the overall thickness of the fold-thrust belt would be tough, but an understanding of structural style in the area, such as the tendency of pink/blue to stack on itself, might be combined with overall surface geology and the big syncline at left to actually estimate the thickness of the fold-thrust belt. Application of structural style might even lead a geologist to conjecture about thrust sheet C (below), as shown below. Seismic data would, of course, fix most of the problems discussed thus far!
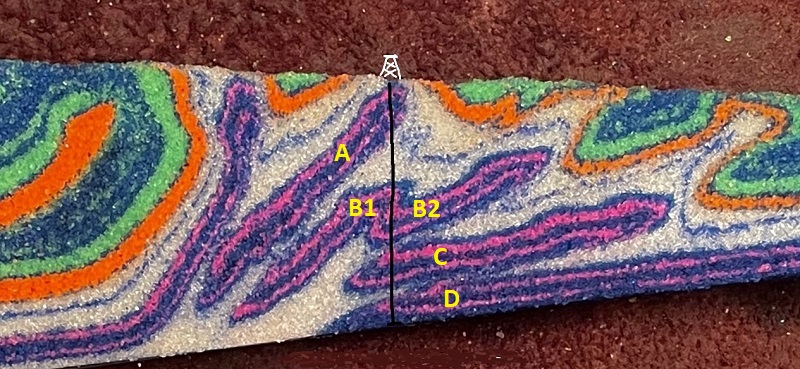
Drilling through the anticline to the base of the fold-thrust wedge would be the final word on just how many pink/blue slices are present, but even the well bore shown as a black line would pass through partial thicknesses on thrust ramps and require some thought. This well bore would then raise even more questions about how far to the right B2 and C extend, which really can’t be determined from surface data. Notably, both B2 and C have end in hanging wall anticlines that are directly below surface synclines.
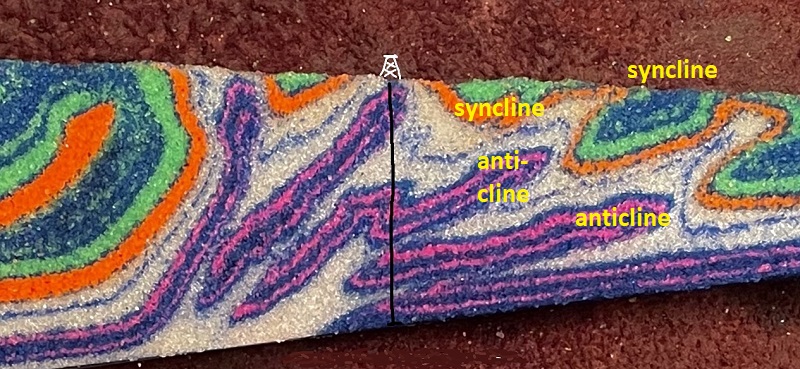
Anticline-under-syncline arrangements are actually reasonably common in shale-rich thrust belts where structures developed in stronger horizons (pink/blue or orange/green) shift slightly past each other within the weak shale layers. In reality, this entire post comes back to the presence of the “shales” (the white microbeads) in the model. The presence of the microbeads is fully responsible for the complex structural style seen in the model. A general conceptual understanding the way weak detachment layers impact thrust belt structure would be key to interpreting this system in the real world. Without consideration of how the weak layers control structure, figuring this system out-even with drilling-would be tough, to say the least!