What does that landslide actually look like, part 2: an active landslide
by Philip S. Prince
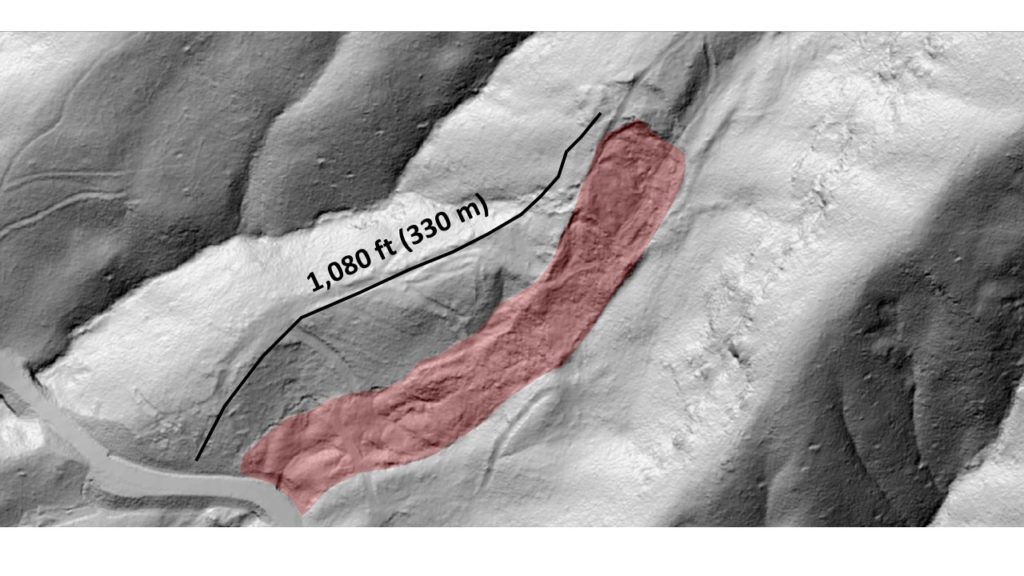
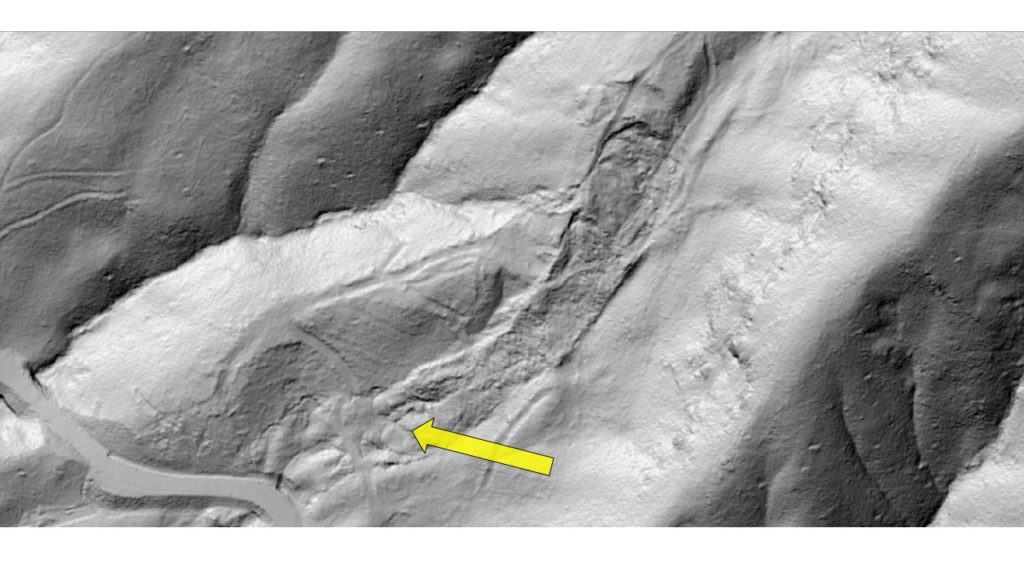
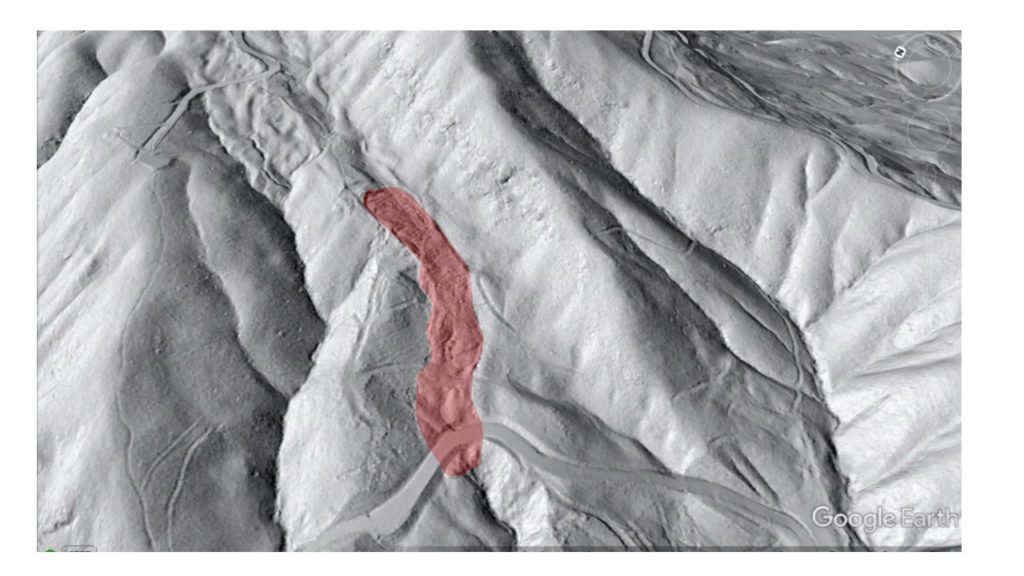
As indicated in the previous post, lidar-derived imagery still needs ground-truthing to maximize its usefulness as a means of characterizing landslides and other slope failures. Last June, Ken Gillon and I visited the Rutherford County, North Carolina, landslide described below as part of our work with Appalachian Landslide Consultants, PLLC (ALC) on behalf of the North Carolina Geological Survey. This slide caught my eye in lidar hillshade imagery because it appeared to share characteristics with an active slide we had visited a few days before. Compared to the slide in the last post, this slide is very subtle in its lidar appearance, due in part to its location in a topographic hollow. For its first appearance in this post, I have highlighted it with a transparent red overlay.
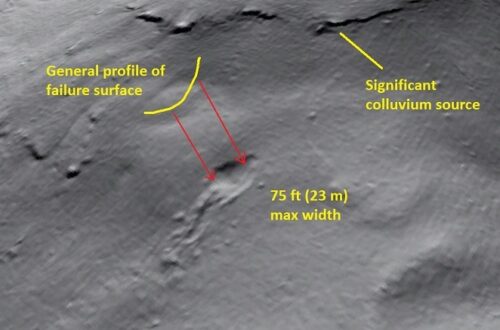
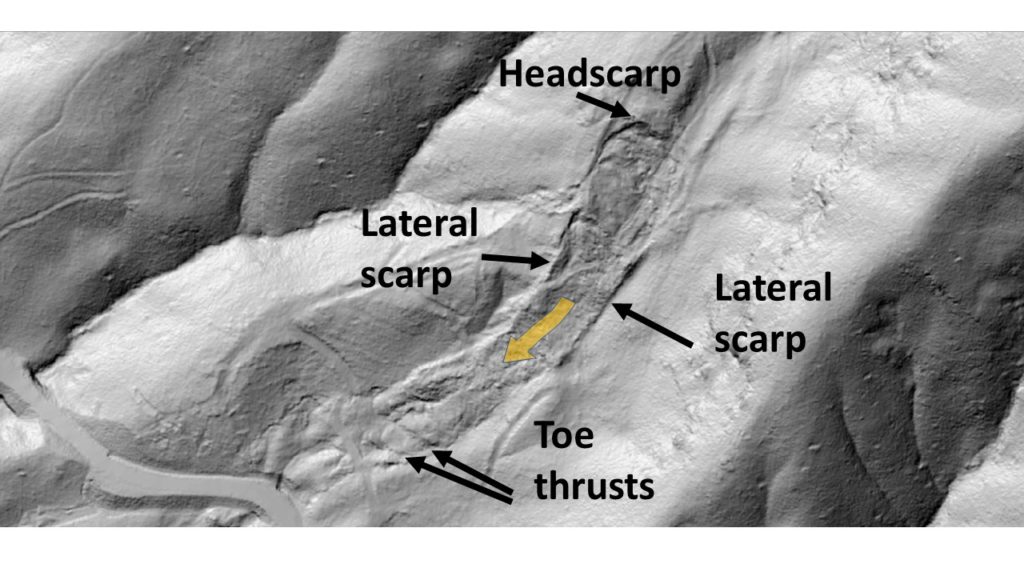
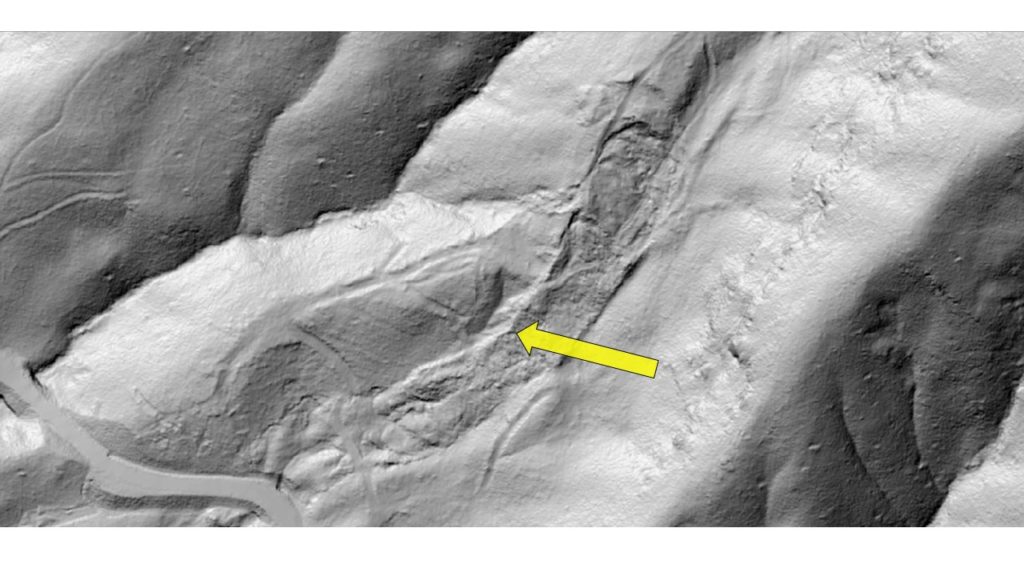
Without the red overlay, the slide may be somewhat difficult to pick out for those who do not evaluate lidar-derived imagery on a daily basis. It is shown without the overlay below, but notable kinematic features are labeled. The faint orange arrow indicates its direction of downslope movement.
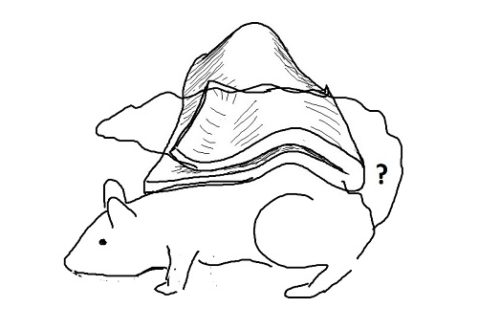
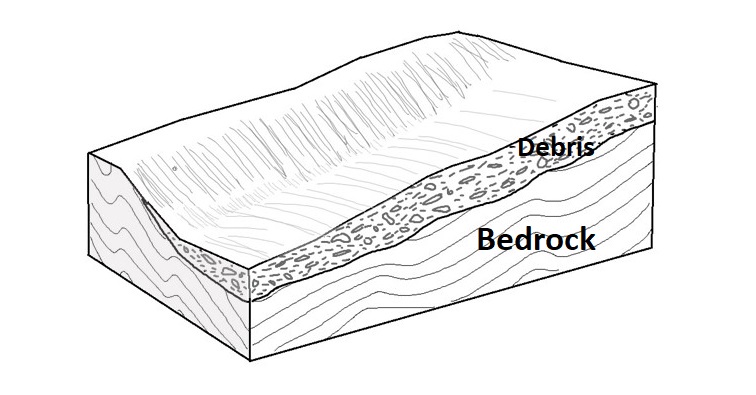
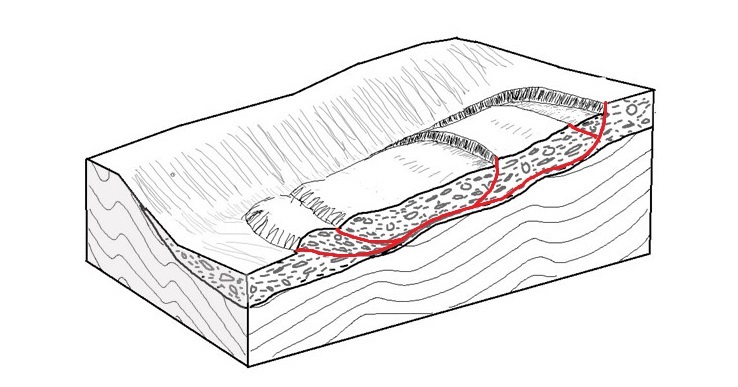
Like the slide in the previous post, this is a debris slide in which rock fragments and boulders derived from nearby steep slopes and cliffs are almost certainly sliding atop underlying bedrock. If the debris deposit is particularly thick, the sliding surface may be entirely within the debris. In either case, the debris is dominated by platy fragments of amphibolite rock. The shape of the amphibolite fragments allows them to slide past each other easily. The position of the slide in a topographic hollow makes it very wet, which also favors sliding. The conceptual drawings below illustrate the general debris slide idea, with the red lines in the lower image highlighting sliding surfaces. Note that they are highly vertically exaggerated compared to the real slide.
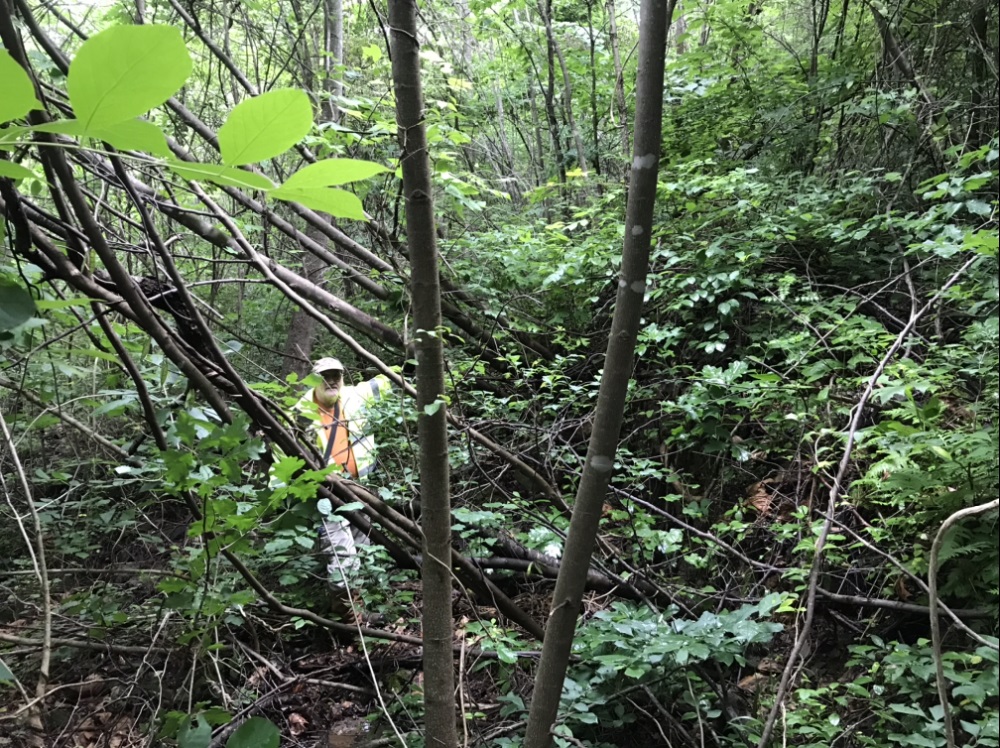
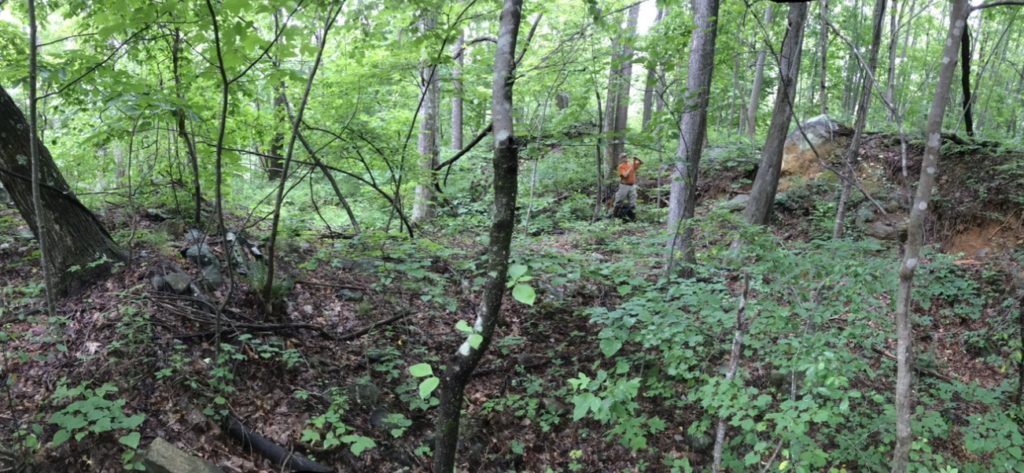
While it is unimpressive in lidar hillshade imagery, this slide was fascinating to visit in the field. It is presently active, although it is moving very slowly and probably episodically. It displays a number of features associated with slow, active landslides that are always interesting to observe in the field. The photos below highlight some of these features. Each is preceded by a lidar hillshade image showing the photo location, with the point of each yellow arrow resting on the photographer’s position. The general pointing direction of each arrow indicates the direction in which the photographer was looking. The images also provide a nice glimpse of what fieldwork looks like in Rutherford County, North Carolina, in June!
After entering the woods from the road downslope of the slide, the first indicator of slide activity is trees being pushed over by the toe of the slide. Ken provides a scale reference in the photo below.
Most of the trees being pushed over are young because this part of the slide was logged within the last ~25 years. This may have contributed to the slide’s present activity, but this is impossible to confirm. Each of the toe thrusts visible in the lidar imagery displays tree push, suggesting all the toe thrusts are actively (but slowly) moving.
The toe thrust structures are associated with minor uplift and bulging of the land surface. As the toe bulges grow and curve, their crests stretch and crack, resulting in open cracks and fissures. In the image below, Ken is seated next to one. Forward-rotated trees are visible next to him; these have not been physically knocked over. Platy fragments of amphibolite are also visible on the margins of the fissure. The photo below was taken very close to the one above.
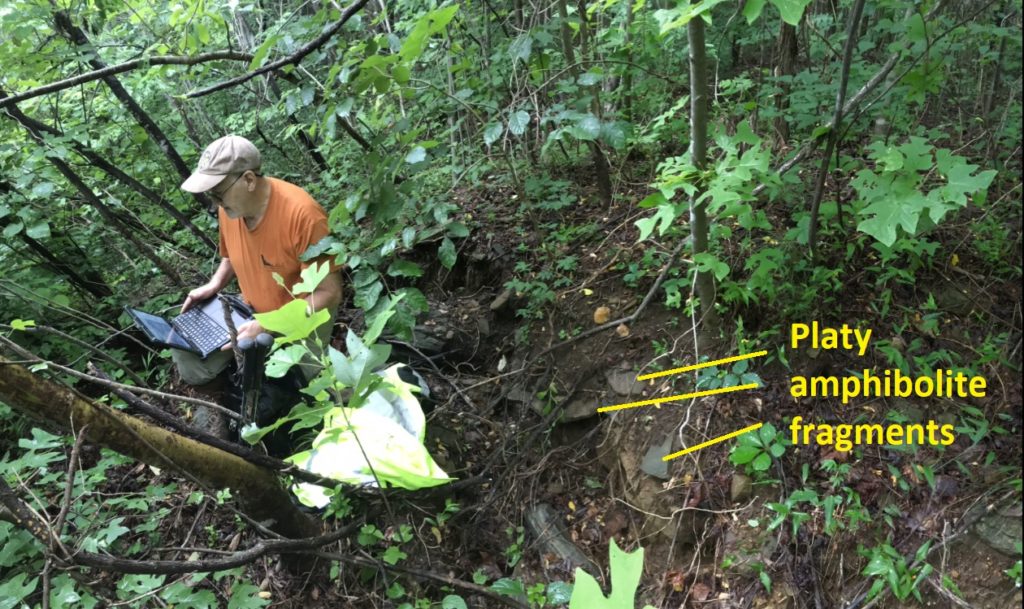
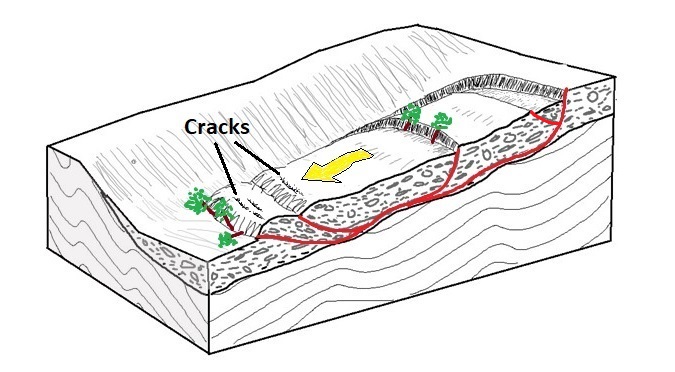
This fresh fissure development or cracking is interesting evidence of slide activity, and the width of the toe bulges indicates that the slide mass is certainly several feet (more than 2 meters, for sure) thick here. The conceptual drawing below shows the location of the fissures or cracks atop the toe bulges. I have also included some trees knocked down by the slide toe, directly below the word “cracks.”
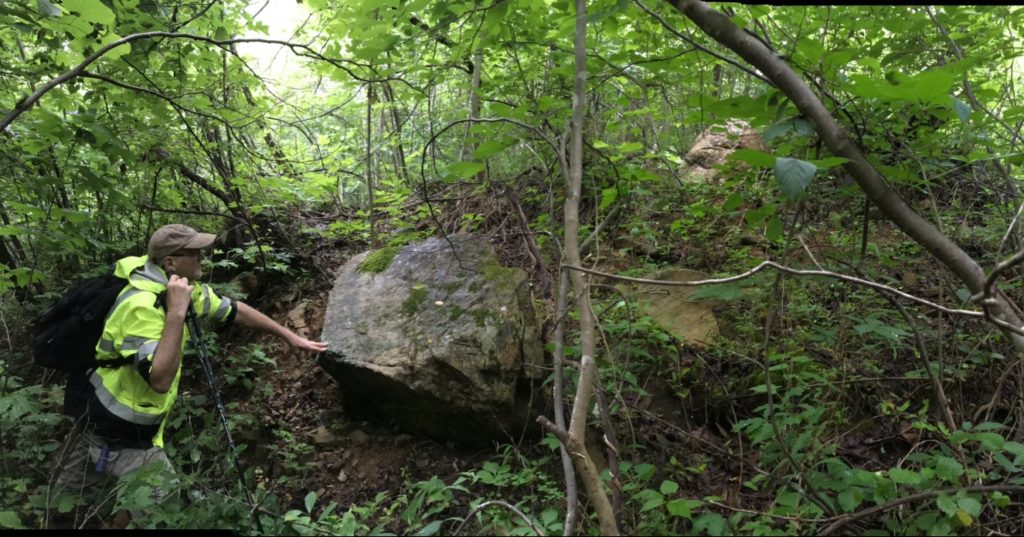
Bulging at toe thrusts also produces locally steep slopes, causing large rock fragments and boulders to dislodge from the steepened area. The boulder in the image below was one of several that had recently dislodged, exposing stained surfaces that were once seated in the soil.
The slide has numerous internal scarps that may result from its movement over an uneven bedrock surface. They may also represent separation and independent movement of single blocks with the overall slide mass. The scarps provided a good look at the debris composition of the slide mass. The next photo shows an internal extensional scarp, somewhat like the one near the middle of the slide mass in the drawing above.
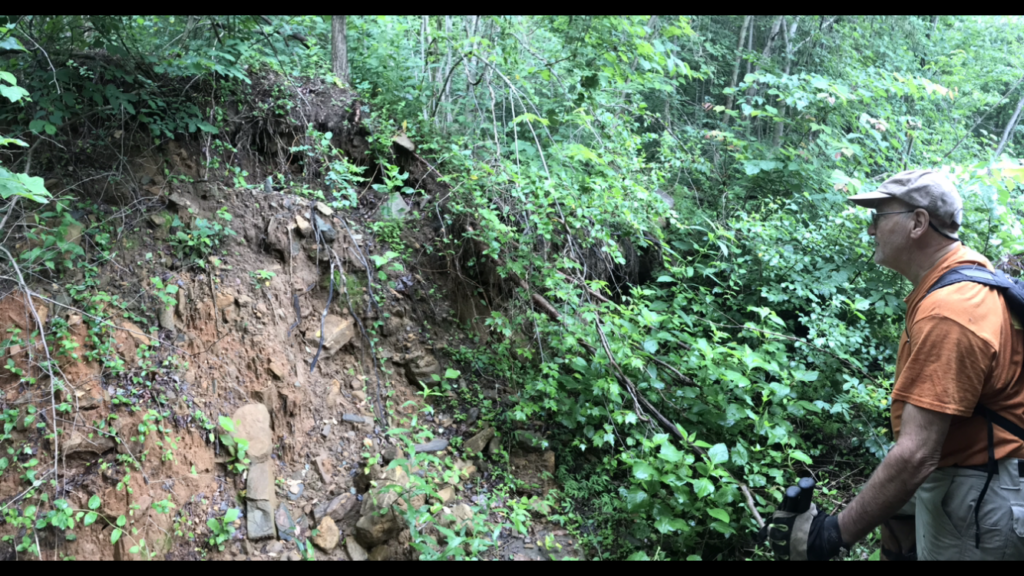
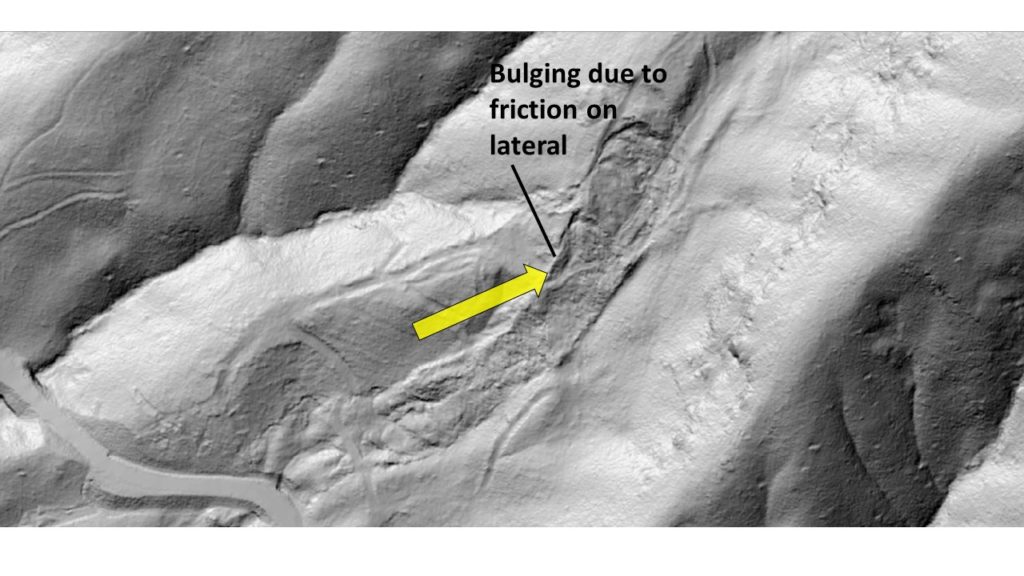
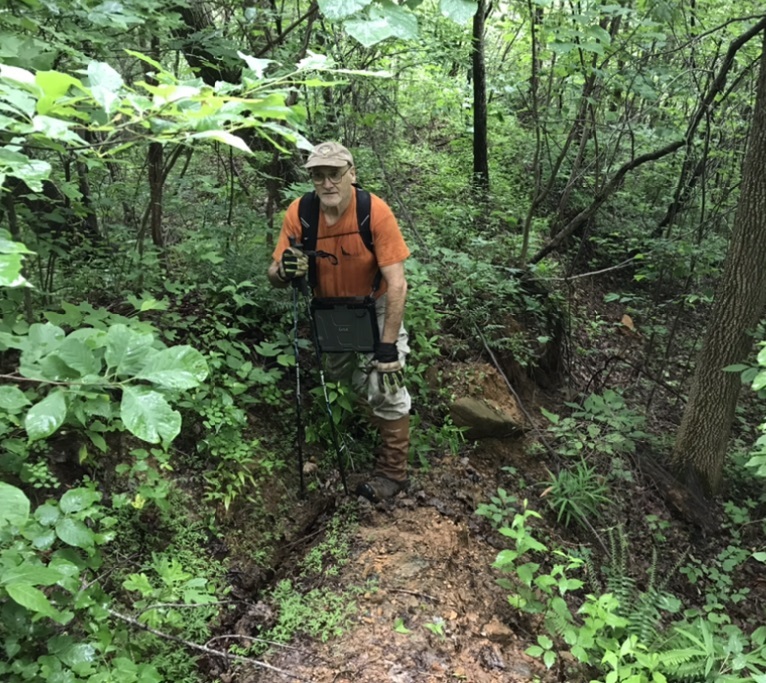
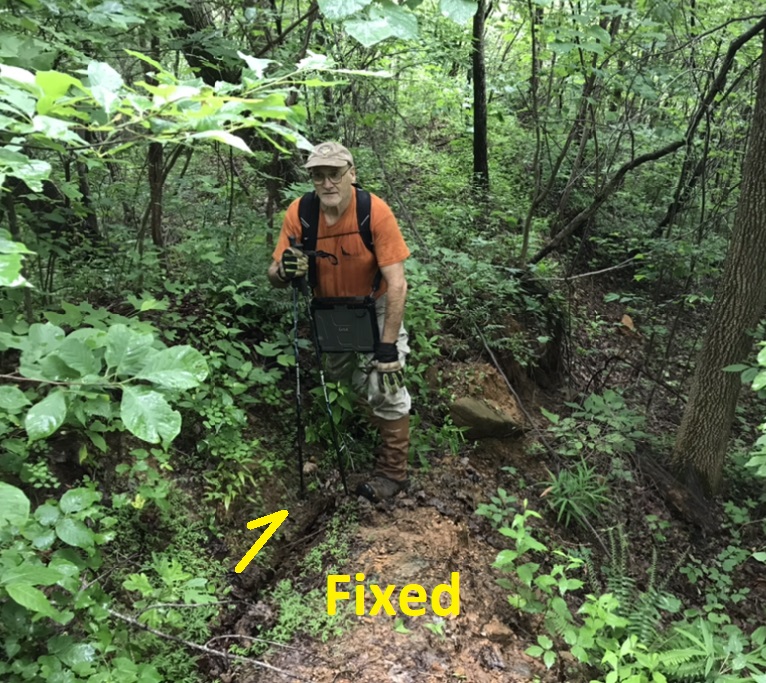
The lateral scarps of the slide displayed local bulging due to their friction against the fixed surrounding ground. The photo below shows the downslope end of one uplifted area.
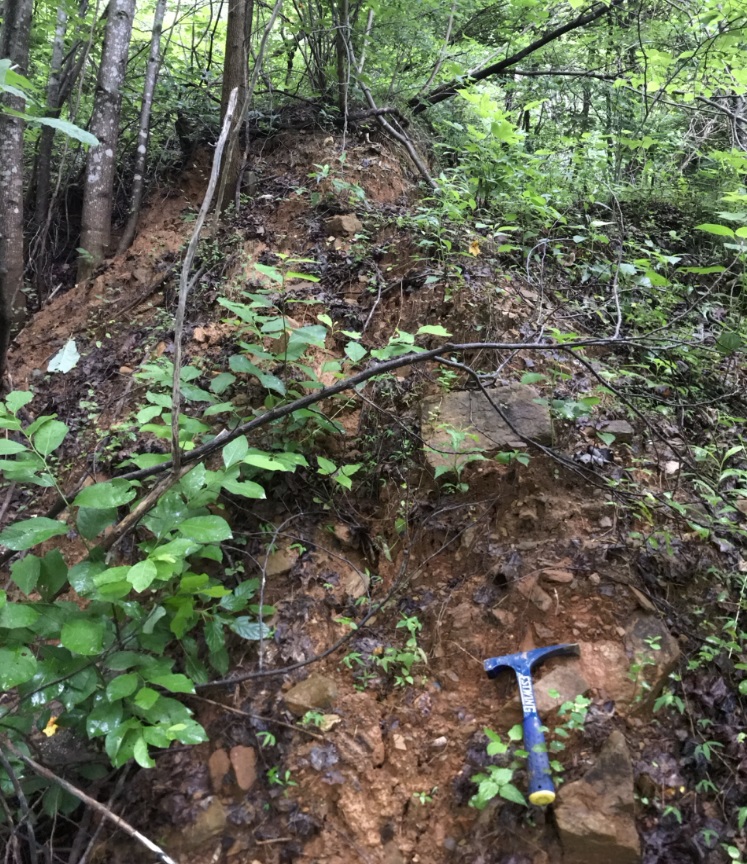
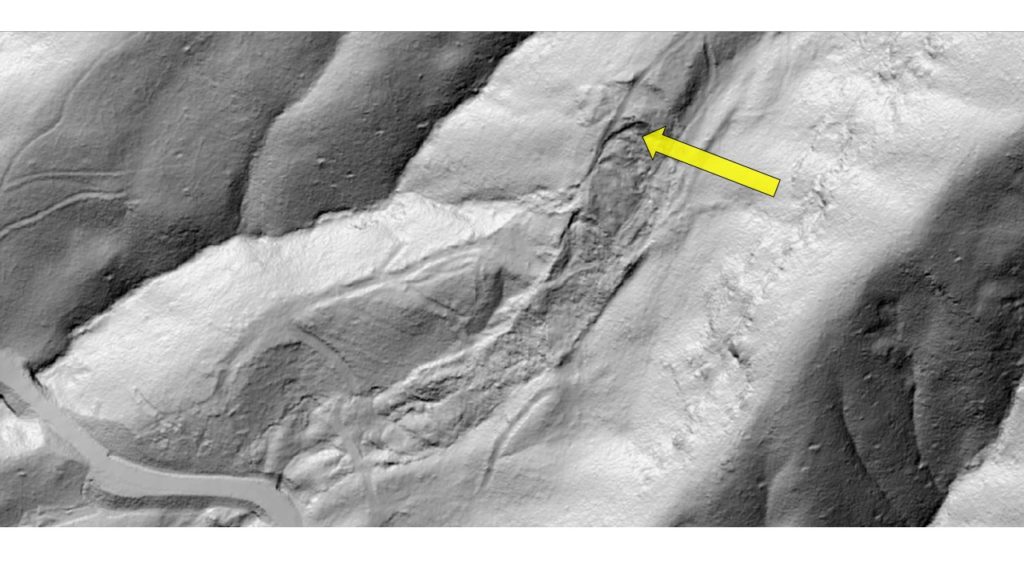
The crest of the uplifted area (near the end of the black pointer line in the lidar image above) displayed a well developed and very crisp surface crack. It is visible at Ken’s feet in the photos below.

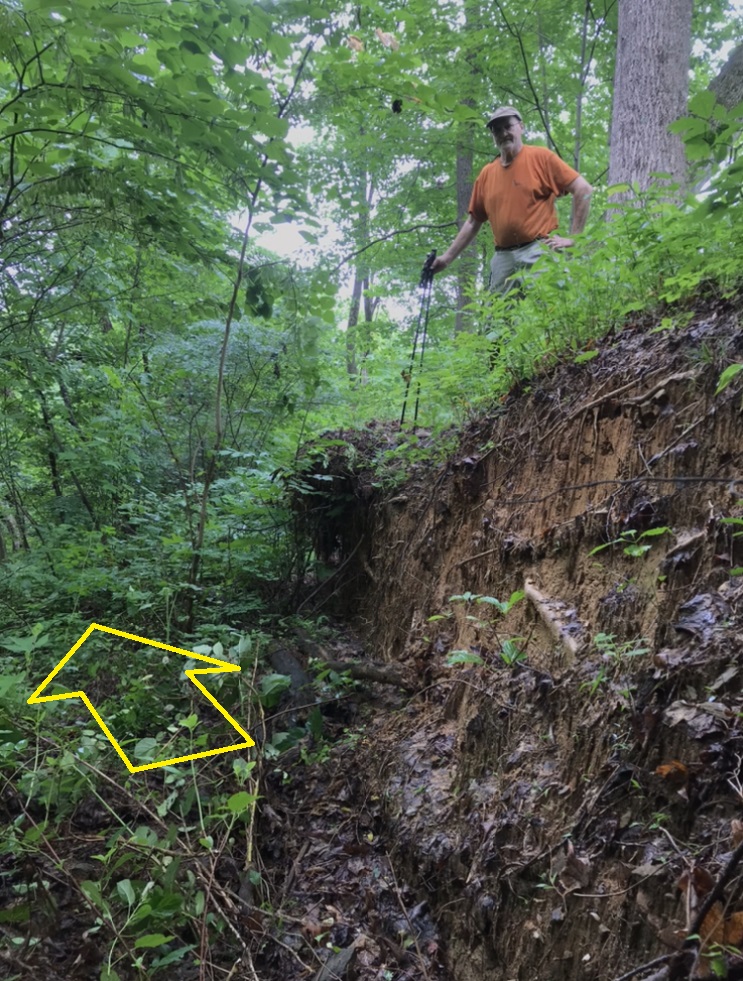
At the upslope end of the lateral bulge, an impressive lateral scarp was visible near its transition into an internal extensional scarp/headscarp. This scarp was very fresh and crisp, and I thought it appeared locally grooved and striated due to the motion of the slide mass that exposed it. These features are not readily discernible in the next photo.

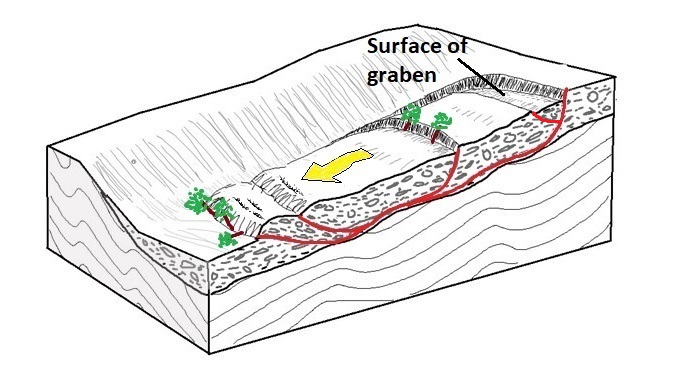
At the uppermost active headscarp of the slide, a broad depression has developed. The depression is likely the surface of a graben, or downthrown block of material bounded on each side by shear surfaces. Trees with root structures compromised by development of the depression were falling in all directions in this area.
The conceptual drawing below shows the position of the graben within the overall slide mass. The scale of the graben on the real slide suggests it might be over 10 feet (over 3 meters) thick in this area, but no field evidence was available to support this.
Even though this slide is not particularly impressive in lidar imagery, it has the potential to be impactful should the immediate area experience any type of development, either infrastructural or residential. The area affected by the slide is, of course, unstable and unsuitable for building. The slide is quite large, and it is unlikely that any sort of engineering work would be able to stabilize it, particularly due to its overall wetness. Its slow motion, however, could make it deceptive to developers who might not pick up on the landscape features described in this post. It is certainly plausible that the area could be cleared and locally graded and construction of a home at least begun (if not completed) before the slow slide movement began to produce very noticeable, irreversible damage. The land surface above the toe of the slide in all of the lidar images is, by contrast, stable, as it is underlain by weathered bedrock with some outcrop. It is perfectly suitable for construction. The area to the right of the slide, which is below cliffs and steep outcrop, is also unsuitable due to its potential to experience future slide movement or rockfall.
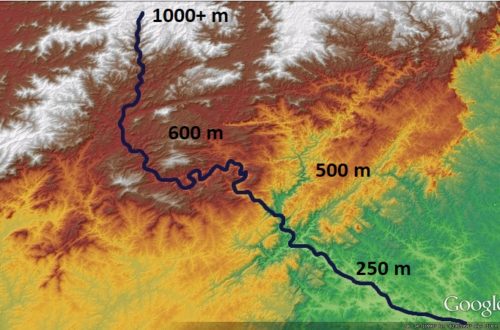
This slide is not unlike a wet “glacier” of rock debris that is slowly creeping its way down the ravine. The perspective of the image below shows the position of the slide with respect to the surrounding topography, as well as its slightly curving path.
Ken and I encountered a few of these active amphibolite debris “glaciers” last summer. It was not possible to definitively determine the reason for their activity, but all were in topographic ravines and hollows, and were thus very wet. All were dominated by platy rock debris, the fragments of which could easily slide past one another. All had experienced logging in recent decades as well. Presumably, the combination of these factors contributed to the slow but ongoing movement of these slides. As far as the slide in this post is concerned, road construction may also have contributed to its reactivation. In the lidar image above, an area below (downslope) of the obvious road grade appears to also be part of the slide mass which is now disconnected by the roadcut. Construction of the roadcut may have destabilized the lower part of the slide mass, causing reactivation to spread upslope. Ultimately, we will never know the specific cause of this or many of the slides in the area, but we definitely know that they are worth avoiding for construction and engineering purposes!
Like so many Appalachian landslides, this one is completely hidden by vegetation for much of the year. It is located near the center of the GIF below, which is comparable to the extent of the lidar image above.
(DEM imagery captured from QL1 lidar data acquired by NC Dept. of Public Safety, raw point clouds assembled and processed by Corey Scheip of the NC Geological Survey Landslide Hazards Program)