Two mappings of a folded thrust fault in the Appalachian Valley and Ridge, 100 years apart
by Philip S. Prince
Well, actually 98 years, but close enough…
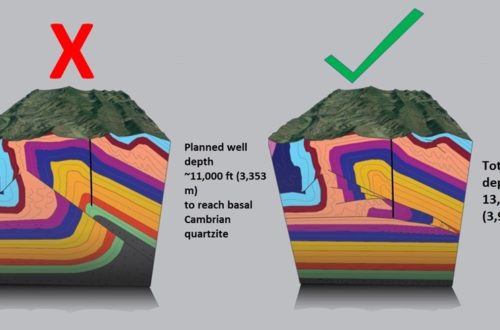
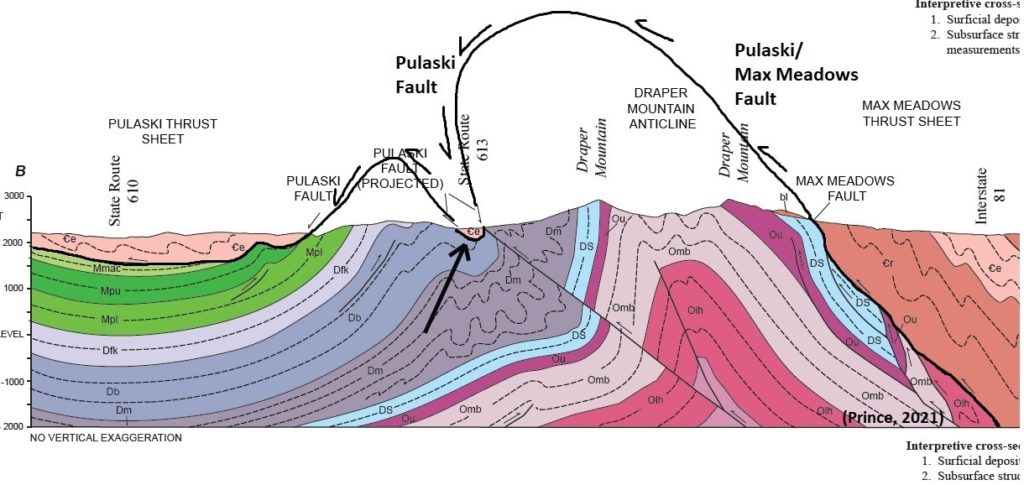
Northwest of Hamilton Knob in Wythe County, Virginia, two narrow outcrop bands of Cambrian dolomite are entirely surrounded by Devonian-aged shales and sandstones. These dolomite bodies are tiny klippen that are separated from the Devonian units by the Pulaski Thrust Fault, which has been folded into two anticlines separated by a narrow syncline in which the klippen occur. I mapped in this area during the last year and a half, and I think this might be the most extreme example of folding of the Pulaski Fault system within the Valley and Ridge. In the cross section below, the large black arrow points to one of the klippen. The curving black line is a projected estimate of the folded geometry of the Pulaski Fault prior to erosion to present-day levels.
The GIF below shows the approximate line of section above and points out two of the “micro-klippen.” The klippe crossed by the section line is just large enough to impact land use, allowing it to be seen as a brown, cleared area surrounded by the forested, acidic Devonian shale/sandstone landscape. The smaller klippe is too small to impact vegetation or land use.
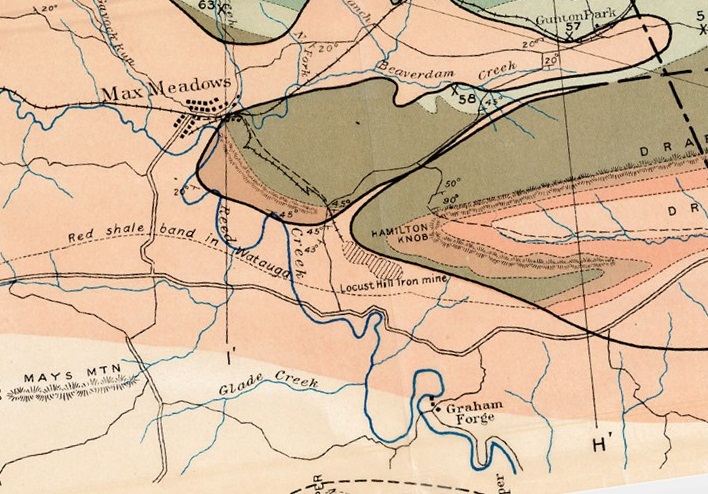
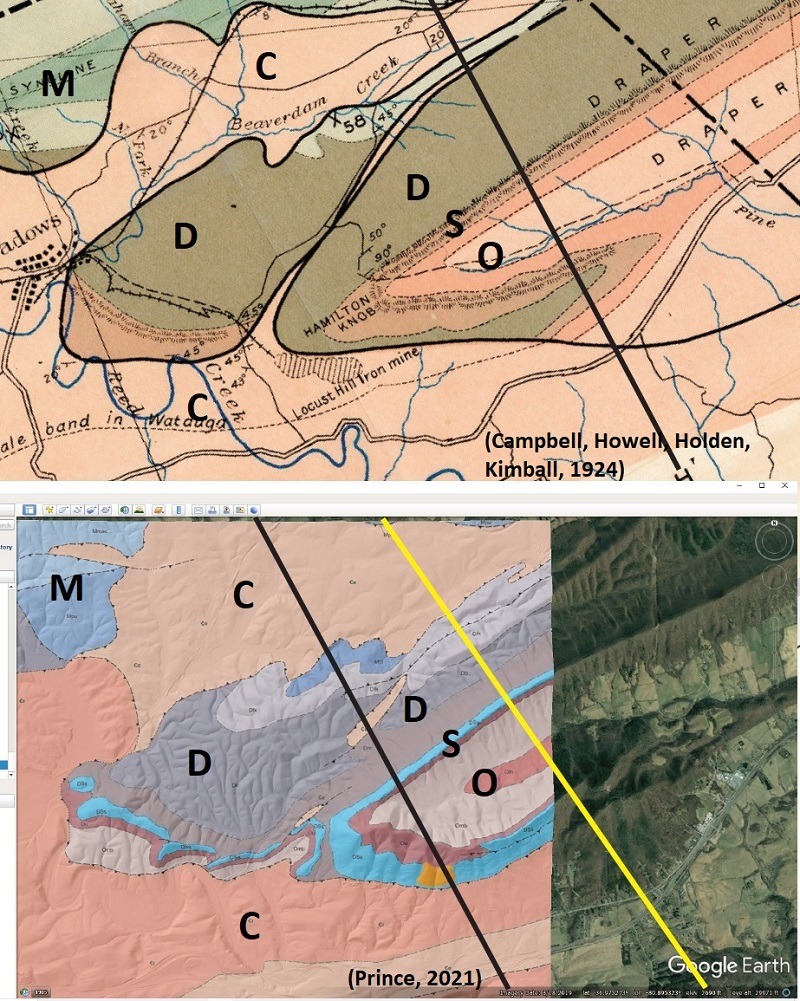
These klippen are made even more interesting by the fact that they were mapped and correctly interpreted in 1924! The image below compares a 1924 map by Campbell, Howell, Holden, and Kimball to my 2021 mapping, which was produced entirely through new fieldwork and lidar analysis. M, D, S, O, and C denote Mississippian, Devonian, Silurian, Ordovician, and Cambrian outcrop zones, respectively. The curving black lines in the 1924 map are the Pulaski Thrust, which correctly encloses a narrow sliver of Cambrian rock (peach) between two extensive Devonian (dark green) outcrop fields (south of “Creek” in the Beaverdam Creek label and the 45 dip measurement). Comparing these maps separated by 98 years and considerable changes in land use, geologic exposure, tectonic understanding, and imaging technology is very interesting to me. The same patterns and structural relationships are obviously present in both to a high level of detail, which is impressive given the much larger scale of the 1924 map project. The map is part of a massive, regional overview of coal resources in the Virginia Valley and Ridge, which is why I never took the time to check it out until now. This “Valley Coalfield” report is linked here; the map comes at the very end of the 381-page document.
Identification and mapping of the distinct rock in the klippen in 1924 is not terribly surprising. Due to land use at the time, vegetative cover was much less extensive and outcrop was more visible. Iron ore also occurs along carbonate-Devonian shale contacts in the area, so special attention was paid when those rock types were expected in an area. The interpretation of the klippe as the result of folding of a thrust fault, however, is quite interesting in light of understanding (or lack thereof) of fold-thrust belts at the time. I am impressed that this intensely folded thrust model arose out of the prevailing theories about the nature of thrust faulting at the time, but it provides just about the only way to explain the architecture of the rocks in the area. The cross sections below compare the 1924 interpretation (line of section is the straight black line in the 1924 map) with my 2021 interpretation, with colors adjusted to match. The 1924 section was developed slightly north of mine, but the overall context of the klippe related to adjacent fold structures is the same. Black arrows point out the Cambrian micro-klippe in each section.
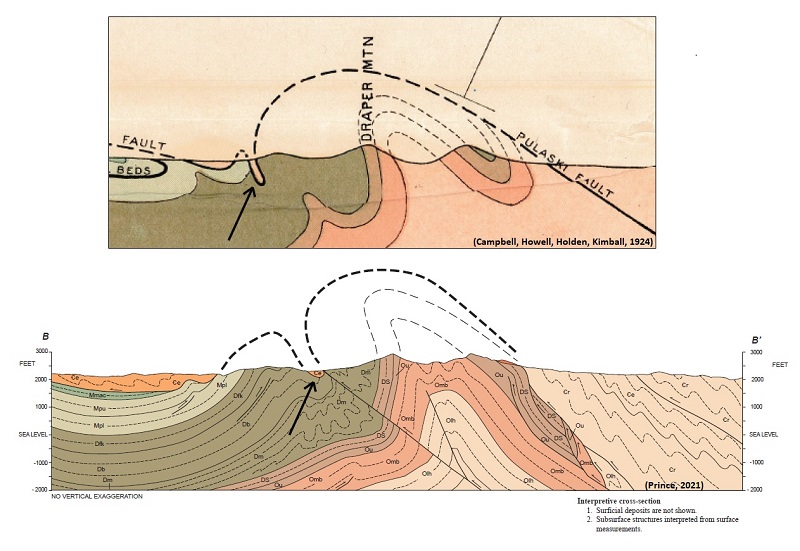
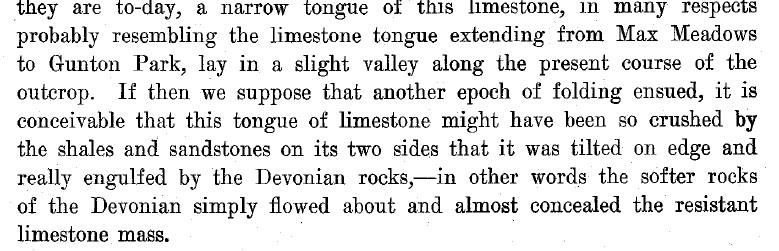
In 1924 and today, a key component of understanding these micro-klippen is explaining the tightness of the syncline that preserves them. After my work in the area, I think it is largely attributable to mechanical contrasts in the rock mass. The dark green horizons in the sections above are shale-rich and weak compared to the overlying light green Mississippian sandstones and underlying Siluro-Devonian sandstones (light brown). The base of the Pulaski Thrust Sheet itself (pale orange) is probably mechanically weak as well, consisting of thin-bedded carbonate which is often extensively brecciated. As a result, the forelimb of the overall Draper Mountain anticline was able to tightly buckle and nearly enclose a tiny pod of the Pulaski Sheet carbonates. This behavior would not have occurred with a different mechanical combination of strata. Campbell et al. had a generally similar idea, and explain the concept very nicely in pages 83-84 of the Valley Coalfield text. “Engulf” is indeed a nice word to describe their model.
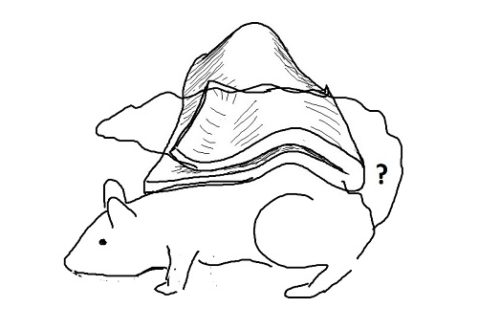
I used the conceptual model below (it’s a very slow moving GIF…wait for it) for my own explanation of the micro-klippen. Early broad folding of the Pulaski and Max Meadows Thrust Sheets occurs when the Draper Block moves onto an underlying flat, probably developed in middle Devonian shale. The future micro-klippen are rotated forward on the forelimb of the block. In this geometry, weak units on both limbs of the Draper Block are poised to slip on or close to bedding planes, setting the stage for a localized “pop-down” syncline in the zone of weak, shale-rich interbeds. This model requires relatively little displacement on the out-of-sequence faults due to the pre-existing ramp anticline geometry, as well as the position of the future micro-klippen on the upper Devonian-Mississippian ramp. Interestingly, Campbell et al. draw the klippen in this ramp position as well, suggesting we placed formation boundaries on similar marker beds.
So, has re-mapping this area offered any improvement on a such a good but 98-year old product? Yes. New mapping is spatially much better; the 1924 map cannot be draped onto an existing surface map with decent accuracy. Subsurface interpretations are also better, applying more rigorous geometric controls obtained by outcrop mapping and detailed lidar topography. Details of the Pulaski Thrust Sheet and particularly its immediate footwall are also better in the newer map, due to its smaller spatial scale and (again) the ability to track individual beds using lidar. The present map results also have much more context within the overall study of fold-thrust belt evolution, both in the Appalachians and in other systems around the world. Even so, the 1924 product is surprisingly high-quality and interpretively ahead of its time. I will actually be using it in my current mapping to the north of this area, as it shows in great detail where coal beds are cut of by thrust faults that are extremely difficult to identify in the field or with lidar.
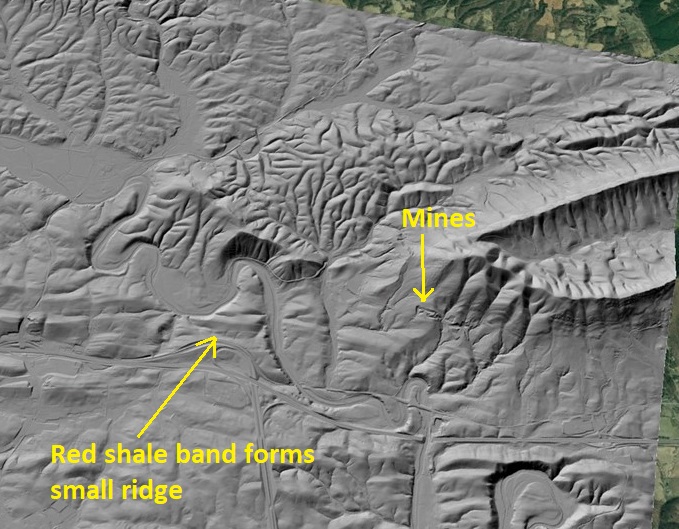
Beyond the scientific details, I like the 1924 map because its details capture specific challenges of working in the area that persist today. My favorite is marking of the “Red shale band in Watauga” with a dashed line, running just left of, then below, the center of the 1924 map image below. The Watauga Formation, today known as the Rome Formation, is intensely folded and stratigraphically baffling in this area. Determining whether you are mapping near its base or top feels impossible, as marker beds are few and far between. Campbell and his associates obviously jumped on the red shale band in hopes of using it as some sort of recognizable frame of reference within the confusing sea of folds. I did exactly the same thing, as the red shale band is very recognizable in lidar-derived imagery as well as in the field (lower image). It can be tracked over significant distances and does indeed highlight some larger folds within the Rome Formation, some of which help define contacts with the overlying Elbrook Formation as we map it today.